
Abstract
We developed a model system for screening optimal protein purification conditions on a mixed-mode cation exchange resin using a statistical software–generated design of experiment (DOE) model with ChromLab Software’s Multivariable Scouting (MVS) function on the NGC Chromatography System. We evaluated combinations of buffers with varying pH and conductivity to identify optimal binding and elution conditions. An automated tandem and multivariable scouting method was created to identify ideal IgG binding and elution conditions that included different Bio-Rad columns for capture, buffer exchange, and screening interaction modes. With a fully automated screening process, identification of optimal conditions was reduced from the standard five days to less than 18 hours.
Figures


Introduction
Identifying optimal purification conditions can be a time consuming process that requires the evaluation of multiple parameters such as sample, resin, buffer system, pH, salt concentration, and flow rates. Screening one parameter at a time may be suitable in some cases, but varying each condition separately may not capture the interaction effects seen when varying more than one parameter at a time, especially when using mixed-mode columns.
In this study we developed a fully automated way to screen multiple variables combined with tandem purification and the ability to identify ideal purification conditions based on evaluation of the chromatogram. We confirmed the varying levels of purity and recovery by running the purified IgG fractions on a gel.
IgG was first captured using a Bio‑Scale Mini UNOsphere SUPrA Cartridge followed in tandem by a Bio‑Scale Mini Bio‑Gel P-6 Desalting Cartridge. An automated tandem and multivariable scouting method was then generated to screen ideal IgG binding and elution conditions over the Foresight Nuvia cPrime Column. The ligand on this media has three major functionalities: a weak carboxylic acid end group, an aromatic hydrophobic ring, and an amide bond serving as a potential hydrogen bond donor/acceptor. Using DOE, we were able to reduce the evaluation of nine parameters from 81 combinations down to 21. A method was easily created by pasting the different conditions into ChromLab Software’s MVS tool. Tandem purification saved time and sample by eliminating the need to collect a fraction and re-inject it into the system for each condition tested before running it over the mixed-mode column.
With the DOE model, Multivariable Scouting tool, and tandem purification, we were able to test the effects of buffer pH and conductivity on IgG binding and recovery in significantly less time than testing conditions individually and manually.
Materials and Methods
General
Goat serum was purchased from Gibco. Protein fractions were analyzed by SDS-PAGE using 4–20% linear gradient Criterion TGX Stain-Free Protein Gels (Bio-Rad Laboratories) and imaged on a ChemiDoc MP Imaging System (Bio-Rad).
The samples were run on an NGC Quest Plus Chromatography System (Bio-Rad) with a sample pump, two column switching valves (CSVs), two buffer inlets, and a pH valve.
Design of Experiment (DOE)
JMP Statistical Software (SAS) was used to identify the optimal binding and elution conditions on a Nuvia cPrime Column for IgG. Two factors, pH and conductivity, were considered in the study. Binding pH and conductivity were both added as two-level continuous factors with lower and upper pH values of 5.3 and 6.8, respectively, and lower and upper conductivity values of 25 and 200 mM, respectively. Elution pH and conductivity factors were also added as two-level continuous factors with lower and upper pH values of 7.4 and 8.6, respectively, and lower and upper conductivity values of 0 and 600 mM, respectively. The model was calculated with three center point replicates for a total of 21 points.
Purification of Goat Serum IgG
Goat serum IgG (Gibco) was purified on a 5 ml Bio‑Scale Mini UNOsphere SUPrA Cartridge (Bio-Rad) and then buffer exchanged on a 50 ml Bio‑Scale Mini Bio‑Gel P-6 Desalting Cartridge (Bio-Rad). The ChromLab 6.0 Software tandem chromatography template “Affinity (5 ml) – Desalting (50 ml) x 1 Column” was used to create the method. The UNOsphere SUPrA binding buffer was 20 mM sodium phosphate, pH 7.5 and its elution buffer 20 mM sodium citrate, pH 3.0, 100 mM NaCl. The P-6 desalting buffer was 50 mM MES pH 6.0, 100 mM NaCl. The method was run at a flow rate of 4 ml/min and A280, conductivity, and pH were monitored throughout the run.
Multivariable Scouting and DOE Chromatography Method
To create a base method, the ChromLab 6.0 Software tandem chromatography template “Affinity (1 ml) – Desalting (10 ml) x 1 Column” was converted to a “Desalting (10 ml) – Affinity (1 ml) – x 1 Column” template that uses a 10 ml Bio‑Scale Mini Bio-Gel P-6 Desalting Cartridge (Bio-Rad) as the desalting column and a 1 ml Nuvia cPrime Column (Bio-Rad) in place of the affinity column. The template has equilibration steps at the beginning that fill the pumps and system with the Nuvia cPrime binding buffer, equilibrates the columns and cleans the loop. Uniform sample injections across multiple runs were accomplished by overloading a 1 ml loop with 1.3 ml of sample and injecting the loop contents onto the desalting column with 0.25 CV of binding buffer. Following sample injection, the Nuvia cPrime Column was brought in line and 0.45 CV of binding buffer used to elute the desalting column onto the Nuvia cPrime Column. Next, the P-6 Column was taken out of line and the Nuvia cPrime Column was washed with 5 CV of binding buffer. At this point the Nuvia cPrime Column was taken out of line and the pumps and system were flushed with the elution buffer solutions at the desired composition. After placing the Nuvia cPrime Column back in line, the column was eluted with elution buffer for 6 CV at the desired composition and then stripped with elution buffer containing 1 M NaCl. A second strip was performed after flushing the system with 0.1 N NaOH and then eluting the column with 5 CV of 0.1 M NaOH. Following the NaOH strip, the system was flushed with elution buffer to remove the NaOH solution and the column was re-equilibrated for 3 CV.
The base method was converted to a DOE multivariable scouting method using the ChromLab 6.0 Software Multi Scout function. The number of runs was set to 21 as required for the DOE model. The scouting method was set up such that pH was determined by the assigned inlet valve port and salt molarity by %B. Binding buffers consisted of 50 mM MES at pH 5.3, 6.0, and 6.8 where buffer A had no salt and buffer B had 1 M sodium chloride. Elution buffers consisted of 50 mM tricine at pH 7.4, 8.0, and 8.6 where buffer A had no salt and buffer B had 1 M sodium chloride. Inlet valves were named according to the pH of their assigned buffers. The DOE scout parameters from JMP Software were copied into the method, the pH’s into the inlet A and inlet B scout table columns, and the salt concentrations, after converting to %B’s, into the %B columns. Fractions (1 ml) were collected into 96–deep well microplates for the flow-through, elution, and strip phases using an NGC Fraction Collector. Injected purified antibody concentrations used in the scouting run were adjusted to produce an A280 less than 1.5 AU. Total run time for the unattended DOE scouting experiment (21 runs) was 17 hours and 36 minutes.
Peak Integration Analysis
Peak integration was performed using the ChromLab 6.0 Software evaluation tool. Auto-integration was performed with the baseline in “By Offset” mode and the peak selection parameters set to slope = 10 and sensitivity = medium. Manual refinements to the integration were made in situations where peaks showed extensive tailing. In these situations, the elution peak was cut after 2 ml were collected. The remainder of the peak area was included as part of the strip peak area.
DOE Analysis
Integration area (A) data were copied into an Excel spreadsheet and %Bound and %Recovery were calculated as follows:
ATotal = AFlowthrough + AElution + AStrip
%Bound = (AElution + AStrip)/ATotal
%Recovery = AElution/ ATotal
The calculated %Bound and %Recovery values were copied into the DOE model spreadsheet and analyzed according to the previously determined model.
Results
The use of DOE to home in on key parameters in combination with ChromLab Software’s tandem and multivariable scouting features minimized the evaluation of nine different parameters from 81 different combinations to 21 and reduced the time it took to run the experiments from five days to less than 18 hours. Optimal conditions were evaluated in a fully automated fashion with a two-column tandem purification using a P-6 Desalting Column to buffer exchange the IgG into the buffer to be screened, followed by a Nuvia cPrime Cation Exchange Mixed-Mode Column for purification.
The 21 different pH and salt molarity conditions for MES binding and tricine elution buffers are listed in Table 1.
Table 1. Binding and elution buffer descriptions.
| Binding — MES | Elution — Tricine | Integration | ||||
| Run | pH | mM NaCl | pH | mM NaCl | %Bound | %Recovery |
| 1 | 5.3 | 30 | 8.0 | 300 | 100% | 100% |
| 2 | 5.3 | 80 | 7.4 | 0 | 100% | 32% |
| 3 | 5.3 | 110 | 8.6 | 600 | 100% | 100% |
| 4 | 5.3 | 200 | 7.4 | 600 | 100% | 100% |
| 5 | 5.3 | 200 | 8.6 | 0 | 100% | 64% |
| 6 | 6.0 | 30 | 8.6 | 0 | 77% | 44% |
| 7 | 6.0 | 30 | 7.4 | 600 | 75% | 62% |
| 8 | 6.0 | 110 | 8.0 | 300 | 22% | 22% |
| 9 | 6.0 | 110 | 8.0 | 300 | 21% | 21% |
| 10 | 6.0 | 110 | 8.0 | 300 | 21% | 21% |
| 11 | 6.0 | 110 | 8.0 | 0 | 28% | 3% |
| 12 | 6.0 | 200 | 8.6 | 600 | 5% | 5% |
| 13 | 6.0 | 200 | 7.4 | 300 | 6% | 6% |
| 14 | 6.8 | 30 | 8.0 | 0 | 17% | 17% |
| 15 | 6.8 | 30 | 7.4 | 300 | 19% | 19% |
| 16 | 6.8 | 30 | 8.6 | 600 | 18% | 18% |
| 17 | 6.8 | 110 | 7.4 | 600 | 3% | 3% |
| 18 | 6.8 | 110 | 8.6 | 300 | 4% | 4% |
| 19 | 6.8 | 200 | 8.0 | 600 | 0% | 0% |
| 20 | 6.8 | 200 | 8.6 | 0 | 0% | 0% |
| 21 | 6.8 | 200 | 7.4 | 0 | 0% | 0% |
The contour plots in Figure 1 indicate better binding of IgG at lower pH independent of the salt concentration. This indicates that the Nuvia cPrime Resin could be used for an intermediate or polish step as it binds the protein in the presence of NaCl.
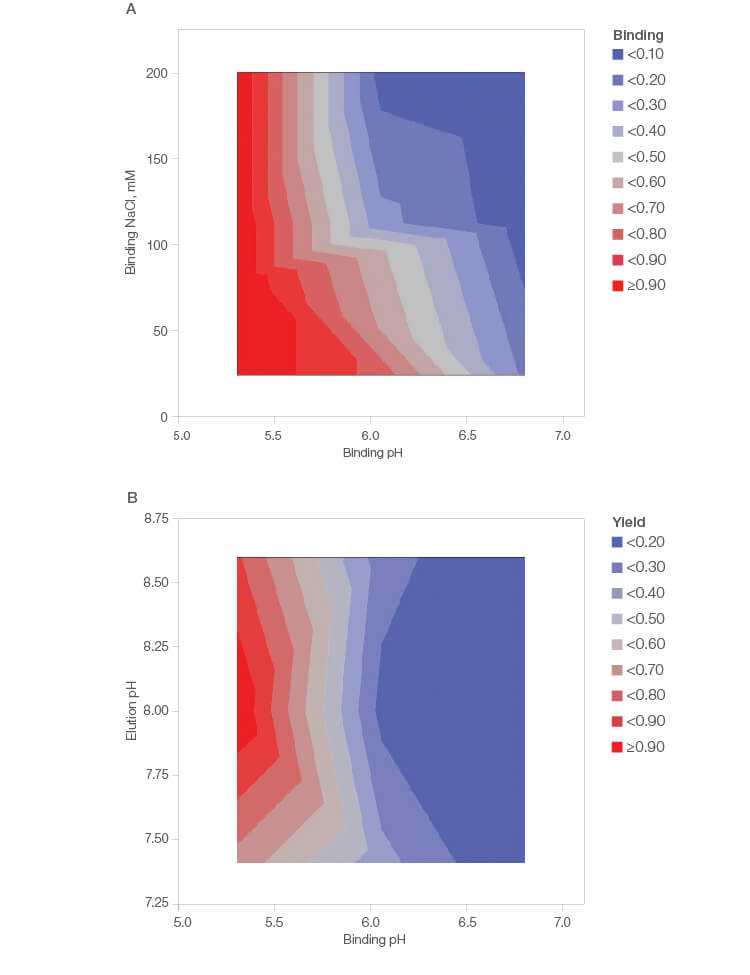
Fig. 1. JMP Statistical Software contour plots showing binding (A) and yield (B) based on pH and salt concentration.
Multivariable scouting was run on a Nuvia cPrime Cation Exchange Column using ChromLab 6.0 Software on the NGC Chromatography System. Binding buffer was 50 mM MES and elution buffer was 50 mM tricine. NaCl concentration and pH were varied in both buffers. Three examples, shown in Figure 2, show good, poor, and negligible binding and recovery with 100% binding and 100% recovery (Run 1), 21% binding and 21% recovery (Run 9), and 0% binding and 0% recovery (Run 21), respectively. Good binding and elution were seen in Figure 2A, binding buffer at pH 5.3 with 30 mM NaCl, elution buffer at pH 8.0 with 300 mM NaCl. Nonideal binding and elution were seen in both Figure 2B, binding buffer at pH 6.0 with 110 mM NaCl, elution buffer at pH 8.0 with 300 mM NaCl, and Figure 2C, binding buffer at pH 6.8 with 200 mM NaCl, elution buffer at pH 7.4 with 0 mM NaCl. The data break from 10–14 ml was the system flush step.
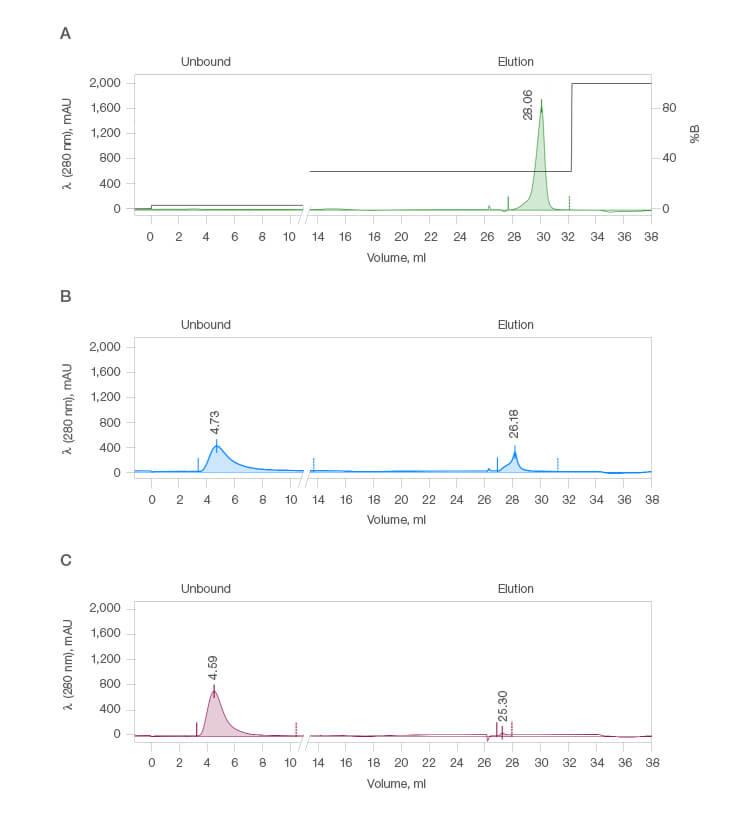
Fig. 2. Chromatograms representing good (A), poor (B), and negligible (C) IgG binding.
The recovery values of purified IgG under different conditions and represented in chromatograms were confirmed by running the IgG, reduced IgG, and column strip fractions on a gel (Figure 3).
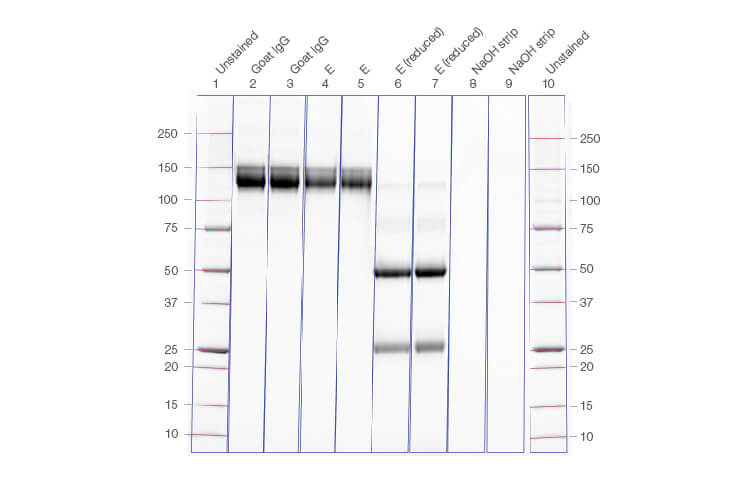
Fig. 3. Gel image confirming the yield of IgG, reduced IgG, and column strip fractions run from the corresponding chromatogram. Lanes 1 and 10, Precision Plus Protein Unstained Protein Standard; lanes 4 and 5, eluate of the elution phase.
Conclusions
In this study, we demonstrated that using DOE in JMP Software with the Multivariable Scouting tool in ChromLab 6.0 Software and setting up a tandem purification on the NGC System can greatly cut down the time it takes to screen optimal binding and elution conditions for IgG on the Nuvia cPrime Cation Exchange Mixed-Mode Column. Statistical software also aided in reducing the workload by providing 21 combinations for both binding and elution buffers versus the 81 combinations that would have been required without the two-parameter, two-level fractional factorial DOE approach.
Time was also saved during the analysis and assessment of optimal conditions by evaluating chromatograms while screening because gels did not need to be run for all the conditions. However, using Criterion TGX Stain-Free Gels when needed helped save additional time since the gels do not need to be stained and destained before imaging.
These tools and methods can be used as a model system to streamline screening for optimal purification conditions of various proteins in any area of research, discovery, or drug development.
Test drive ChromLab 6.0 Software today.
Bio-Rad is a trademark of Bio-Rad Laboratories, Inc. in certain jurisdictions. TGX Stain-Free Precast Gels are covered by U.S. Patent Numbers 7,569,130 and 8,007,646. All trademarks used herein are the property of their respective owner.