The ability to interrogate protein phosphorylation events and aberrant phosphorylation levels is critical to our understanding of various biological and pathological processes, particularly in the research of diseases, like cancer. However, detection of phosphorylated proteins in western blots can be challenging. We have developed ten tips to ensure robust data generation and cleaner blots.
Topics include:
- Inhibition of protein degradation and conservation of posttranslational modifications during sample preparation
- Selection of phospho-specific antibodies
- Probing for total protein
- Induction of phosphorylation
- Treatment with phosphatase
- Concentration of samples
- Optimization of blocking reagents
- Types of membranes
- Washing
- Analysis of total protein normalization (TPN)
Inhibition of Protein Degradation and Conservation of Posttranslational Modifications during Sample Preparation
Disruption of cell membranes releases enzymes that can degrade and/or dephosphorylate proteins. To minimize their activity, you should keep your samples on ice and pre-chill all buffers (Scopes 1994). We also recommend supplementing lysis buffers with protease and phosphatase inhibitor cocktails.
2
Selection of Phospho-Specific Antibodies
When selecting a phospho-specific antibody for your experiments, it is crucial to ensure that the antibody specifically detects the protein of interest only when it is phosphorylated at the indicated site. It is also essential to check that the antibody detects a band at the correct molecular weight for your phosphorylated target protein. Keep in mind that each phosphorylation adds 80 Da to the molecular weight of the protein (Walsh 2006).
3
Probing for Total Protein
Using an antibody that detects the total level of your target protein enables you to determine the phosphorylated fraction relative to the total fraction. This allows you to compare the impact of different treatments and provides an internal loading control (Figure 1A). A simple way to do this is to multiplex, so you can look at the target total and phospho-protein at the same time (Figure 2). See more examples.
4
Induction of Phosphorylation
You might need to stimulate the cells before harvesting to ensure your protein is phosphorylated. For instance, the target protein might be phosphorylated at the site of interest upon activation of a particular cell signaling pathway. In this example, cells were treated with epidermal growth factor (EGF) to induce phosphorylation of its receptor EGF R, at tyrosine 1148 (Figure 1B). Upon successful treatment, the target protein will be phosphorylated at the site of interest.
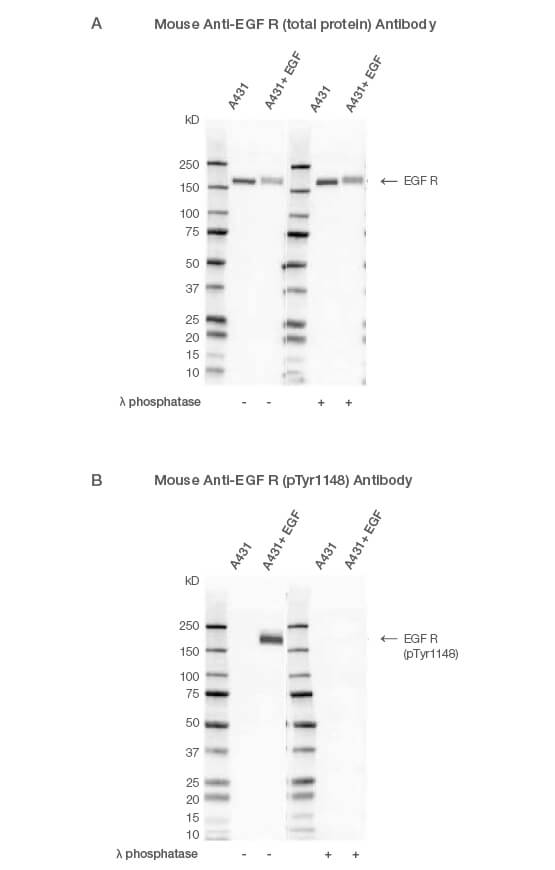
Fig. 1. Western blot analysis of A431-untreated and EGF-treated whole cell lysates probed with (A) Mouse Anti-EGF R Antibody (catalog #VMA00061) or (B) Mouse Anti-EGF R (pTyr1148) Antibody (#VMA00751) followed by detection with HRP-conjugated Goat Anti-Mouse IgG (1:10,000, #STAR207P). Membranes were treated with (+) and without (-) lambda protein phosphatase and visualized on the ChemiDoc MP Imaging System with a (A) 6 sec or (B) 25 sec exposure.
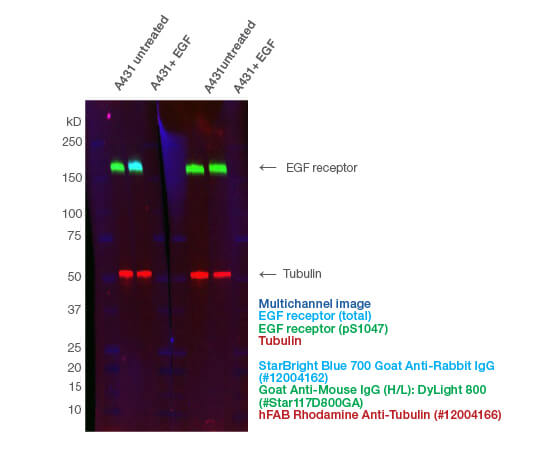
Fig. 2. Fluorescent multiplexing enables the quantification of phosphoproteins on a single blot. The phospho-specific Mouse Anti-EGF Receptor pSer1047 (#VMA00746) and anti-total Rabbit Anti-EGF Receptor (#VPA00900) antibodies were incubated together. hFAB Rhodamine Anti-Tubulin was added with the fluorescent secondary antibodies. The fluorescent images were captured using the ChemiDoc MP Imaging System.
5
Treatment with Phosphatase
A common control for phospho-specific antibodies involves treating your lysates with calf intestinal phosphatase or lambda protein phosphatase. If the antibody is phospho-specific, the signal will disappear after phosphatase treatment (Figure 1). Lambda protein phosphatase can be used to remove both serine/threonine and tyrosine phosphorylation and calf intestinal phosphatase phospho-tyrosine residues.
6
Concentration of Samples
When looking at a relatively rare phosphorylation event, you should use the smallest volume of lysis buffer possible to concentrate your sample. Alternatively, if the subcellular location of your protein of interest is known, for instance if your protein is localized in the nucleus, you could perform cellular fractionations and exclusively use the nuclear fraction on the western blot. You could also consider immunoprecipitation (IP) using an antibody targeting your protein of interest regardless of the phosphorylation state.
7
Optimization of Blocking Reagents
Select the best blocking reagent for your antibody. For phosphorylated target analysis, start with casein in TBS or BSA. Using milk can lead to higher background as it contains proteins that could interfere with the target identification of phosphorylated proteins. Other blocking reagents such as chicken ovalbumin, fish gelatine, and commercially available synthetic blocking reagents may also provide viable alternatives. It is important to remember, when planning any western blot experiment, that there is no one-size-fits-all approach.
8
Types of Membranes
Proteins can be transferred onto nitrocellulose or polyvinylidene difluoride (PVDF) membranes. PVDF membranes have high mechanical strength and are most suitable when membrane stripping and reprobing are required, as is often the case when you are using the total protein as a loading control for your phosphorylated target. As PVDF has a higher binding capacity than nitrocellulose, it is preferred for low abundance phosphorylated targets. However, the increased binding capacity of PVDF also means that you are more likely to see higher levels of nonspecific binding and background compared to nitrocellulose. Low-fluorescence PVDF (LF PVDF) is also recommended if you are doing total protein normalization or using fluorescent secondary antibodies.
9
Washing
The type of buffer used to perform the wash steps can also have an effect on the signal-to-background ratio. In general, the use of tris-buffered saline (TBS) based buffers often yields a stronger signal compared to phosphate buffered saline (PBS) based buffers. Note that the presence of phosphate ions in PBS may interfere with the signal from the phosphorylated target. Adding a detergent like Tween-20 to the wash buffer also helps remove materials nonspecifically bound to the membrane.
10
Analysis of TPN
Total protein normalization (TPN) is a technique used to quantify the abundance of your protein of interest. This involves normalization of the band to the levels of total protein in your samples.
Below is a simplified procedure for performing TPN analysis using Bio-Rad’s stain-free technology (see detailed procedure):
- Load your samples onto one of Bio-Rad’s stain-free gels. Include one set of samples to be blotted with an antibody against the total protein of interest (anti-total antibody) and a second set of samples to be blotted with an antibody against the phosphorylated form of your protein of interest (phospho-specific antibody). If you are performing multiplexing, one set of samples can be blotted with both the anti-total and phospho-specific antibodies
- Perform gel electrophoresis (see the V3 Western Workflow blotting protocol)
- Capture a stain-free image of the gel using Bio-Rad’s ChemiDoc Imager System and Image Lab Software (Figure 3). Stain-free imaging technology is fast − trihalo compounds incorporated into the gel make the proteins fluoresce upon photoactivation (Yadav and Liu 2014), provided the protein contains at least two tryptophan residues
Stain-free imaging technology enables the normalization of bands to total protein in each lane (Taylor et al. 2013). It is necessary to activate the gel at this step for subsequent stain-free visualization of the membrane.
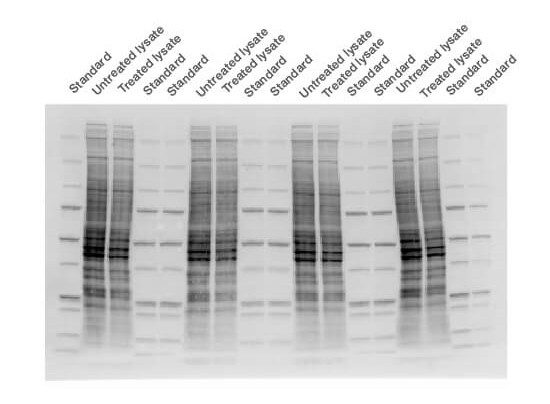
Fig. 3. Stain-free technology image. The membrane was imaged with a stain-free enabled imager prior to chemiluminescent detection.
- Blot membranes with the appropriate anti-total and phospho-specific antibodies
- Following blotting, capture stain-free images of the blots
When using chemiluminescent detection, capture the stain-free images of the blots prior to adding ECL reagents - Calculate normalized intensity for the total and phosphorylated protein of interest using TPN
Use Image Lab Software to calculate TPN normalized intensities for total protein and phospho-specific bands for your protein of interest. Learn more about TPN - Determine the amount of the phosphorylated form of your protein of interest relative to the amount of the total protein for each sample
To do this, divide the TPN-normalized signal intensity of the phosphorylated form of your protein of interest (detected with the phospho-specific antibody) by the TPN-normalized signal intensity of the total protein of interest (detected with the anti-total antibody). Perform this calculation separately for each of the samples analyzed (Figure 4)
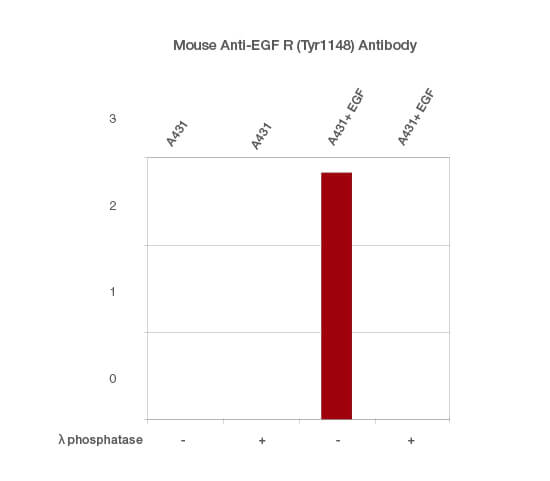
Fig. 4. Normalized signal intensity of EGF R (pTyr1148) from EGF-treated and untreated lysates, treated with (+) or without (-) lambda protein phosphatase. Lambda protein phosphatase dephosphorylates serine, threonine, and tyrosine residues. Normalized signal intensity was calculated by dividing the TPN-normalized signal intensity for each phosphoprotein by the TPN-normalized intensity of the corresponding total protein.
Watch our webinar to better understand the steps needed to obtain clean western blots of phospho-proteins.
References
Scopes RK (1994). Protein purification (New York, NY: Springer New York).
Taylor SC et al. (2013). A defined methodology for reliable quantification of western blot data. Mol Biotechnol 55, 217–226.
Walsh T (2006). Post-translational modification of proteins: expanding nature’s inventory (Roberts and Company Publishers).
Yadav G and Liu N (2014). Trends in protein separation and analysis — the advance of stain-free technology. bioradiations.com/trends-in-protein-separation-and-analysis-the-advance-of-stain-free-technology/, accessed November 11, 2018.
Bio-Rad is a trademark of Bio-Rad Laboratories, Inc. in certain jurisdictions. All trademarks used herein are the property of their respective owner.