Introduction
Two-dimensional (2-D) electrophoresis is a powerful method for the analysis of complex protein samples. It is unparalleled among protein separation techniques in its ability to generate an array of several hundred or more individual separated protein species. The first dimension consists of isoelectric focusing (IEF), most commonly on immobilized pH gradient (IPG) strips, which separate proteins based on their isoelectric point (pI). Following the first dimension, the IPG strip is applied to a slab gel for the second-dimension sodium dodecyl sulfate polyacrylamide gel electrophoresis (SDS-PAGE) separation, which separates proteins on the basis of size. The first dimension separation is often the most critical with respect to its influence on the quality and resolution of the 2-D separation.
A number of factors can affect IEF separations. The solution in which the sample is prepared and in which IEF is conducted can strongly influence the quality of the separation. In general, one wishes individual protein species to separate cleanly and resolve well from one another. This requires solution conditions in which the proteins are maximally soluble, which vary to some degree from sample to sample. The duration of the focusing protocol and the rate at which voltage increases during the run also influence the outcome. For these reasons, first-dimension IEF separations often require optimization with respect to both the separation solution components and the instrument settings used. Failure to optimize these parameters can result in a poor-quality 2-D separation, with horizontal streaking and poorly resolved protein spots being the most likely undesirable outcomes.
Optimization is, however, often forgone in favor of using a standard IEF solution and a standard focusing protocol. The primary reason for this is that standard IEF equipment allows only one set of conditions to be run at a time so that conditions can be compared only among sequential runs. Optimization is therefore very time-consuming if one has access to only a single IEF instrument. Although commercial IEF instruments allow 12 or more IPG strips to be run simultaneously, they rely on a single anode and cathode to apply voltage across all strips. As a result, the current applied to each IPG strip can vary depending on the conductivity of the sample solution. Samples of varying conductivity run simultaneously can lead to inconsistent results, so the general recommendation is to use a consistent sample solution within a single run. A single anode and cathode also means that only a single focusing protocol can be applied at a time.
The PROTEAN i12 IEF system is unique in that the voltage and current are controlled separately and independently for up to 12 individual IPG strips. An individual focusing protocol can be applied to each IPG strip and the current and voltage may be reproducibly controlled regardless of whether sample conductivity is consistent within a run. This allows multiple conditions to be tested simultaneously. As a result, experiments to optimize the sample solution or focusing protocol are much simpler and quicker to carry out.
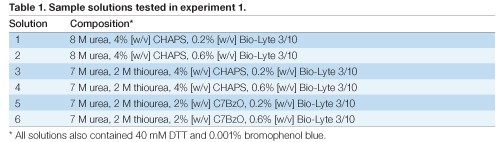
To demonstrate first-dimension IEF optimization using the PROTEAN i12 IEF system, a sample was first prepared in six different sample solutions, systematically testing the effect of the chaotrope mixture (8 M urea vs. 7 M urea plus 2 M thiourea), the detergent (4% CHAPS vs. 2% C7BzO), and the carrier ampholyte concentration (0.2% vs. 0.6% Bio-Lyte® 3/10). Each of the solutions tested was expected to differ from the others in its characteristic conductivity, and this experiment would not have been advisable using an instrument in which the current and voltage applied to each IPG strip could not be independently controlled. A second experiment tested the effect of varying the duration of IEF and the rate at which voltage was increased. Six different focusing protocols were applied to the sample in the optimal IEF solution selected from the first experiment.
Materials and Methods
Urea, Bio-Lyte 3/10, dithiothreitol (DTT), bromophenol blue, ReadyStrip™ IPG strips, SDS, electrophoresis buffers, SDS-PAGE gels, and Oriole™ fluorescent gel stain were supplied by Bio-Rad laboratories, Inc. Thiourea was supplied by Sigma-Aldrich, 3-[(3-cholamidopropyl)dimethylammonio]-1-propanesulfonate (CHAPS) was supplied by Amresco, and 3-(4-heptyl)phenyl-3-hydroxypropyl)dimethylammoniopropanesulfonate (C7BzO) was supplied by EMD.
A crude preparation of yeast mitochondrial membranes was prepared as described previously (Arnold et al. 1998) from a log-phase culture of Saccharomyces cerevisiae strain BJ2168. The protein content was estimated using the DC™ protein assay (Bio-Rad) with BSA as a standard.
The mitochondrial membrane pellet was suspended to a protein concentration of 1 mg/ml into various sample solutions described below. Each sample was sonicated briefly and clarified by centrifugation (5 min, 14,000 × g at room temperature). Samples (200 µl) were loaded by overnight rehydration onto 11 cm pH 4–7 IPG strips. The first dimension was run on the PROTEAN i12 IEF cell as described below. Equilibration and second-dimension SDS-PAGE were performed as recommended in Bio-Rad bulletin #2651, using Criterion™ 8–16% Tris-HCl gels. A lane of Precision Plus Protein™ unstained standards was run on each second dimension. Gels were stained with Oriole fluorescent gel stain, imaged using the VersaDoc™ MP 4000 system, and analyzed using PDQuest™ software.
Experiment 1 — Variation of Sample Solution
The sample was prepared in each of six different sample solutions (Table 1). Each solution was loaded in duplicate. All 12 IPG strips were run simultaneously in the PROTEAN i12 IEF cell using the preprogrammed Rapid protocol for the IPG strip type
(8,000 V, 50 µA, 26,000 Vh followed by a hold step at 750 V). The IPG strips were allowed to remain at the hold voltage until all 12 had completed the run, at which time they were transferred to storage at –80°C.
Experiment 2 — Variation of Focusing Protocol
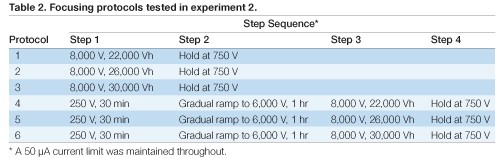
The sample was prepared in a 7 M urea, 2 M thiourea, 4% [w/v] CHAPS, 0.6% [w/v] Bio-Lyte 3/10 solution (solution 4 from Table 1). Twelve IPG strips were loaded with this sample and six different focusing protocols were applied, each to a pair of IPG strips. The focusing protocols are shown in Table 2. Each IPG strip was removed from the instrument and stored at –80°C within 30 minutes of entering the final Hold step.
Results
Effect of Sample Solution Composition
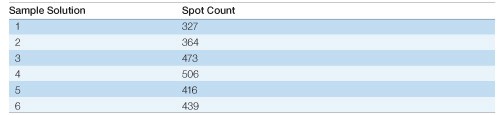
Each sample solution (Table 1) showed a distinct voltage vs. time profile during IEF for 26,000 Vh (Figure 1). All of the sample solutions tested resulted in qualitatively similar 2-D patterns (Figure 2), but with varying spot counts (Table 3).
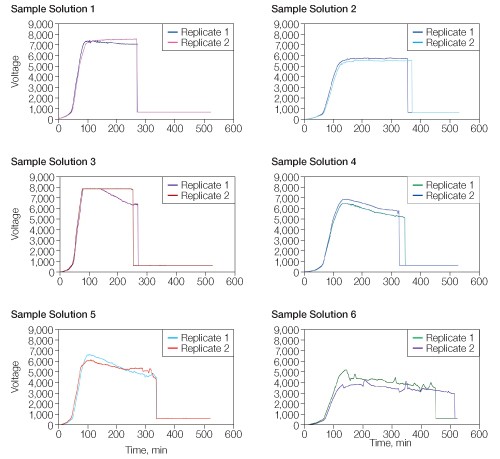
Fig 1. Effect of sample solution on voltage vs. time profile. Sample solutions were as described in Table 1. IEF was conducted for 26,000 Vh using a single-phase protocol with voltage and current limits of 8,000 V and 50 µA, respectively. Run data were downloaded from the PROTEAN i12 IEF cell and analyzed using Microsoft Excel.
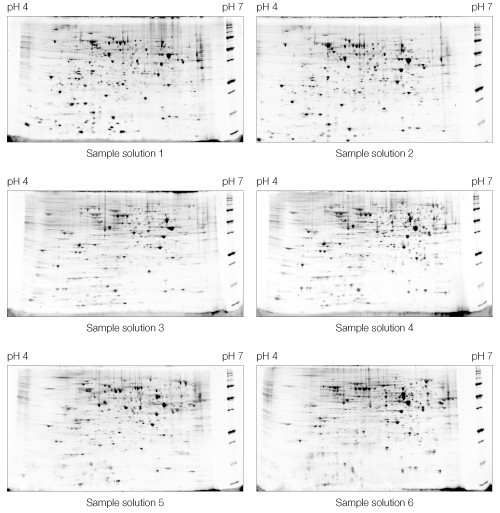
Fig 2. Effect of sample solution composition on 2-D electrophoresis of yeast mitochondrial membrane proteins. Sample solutions are as described in Table 1. First dimensions were run on 11 cm pH 4–7 IPG strips. Second dimensions were run on Criterion 8–16% Tris-HCl gels. A representative Oriole-stained gel from each replicate pair is shown.
Table 3. Effect of sample solution composition on spot counts. Spot counts for the gels shown in Figure 2 were generated with PDQuest software using identical spot detection parameters for each gel.
Focusing in 7 M urea, 2 M thiourea resulted in noticeably more spots, particularly among higher molecular weight proteins and those in the higher pH region of the gradient (Figure 3).
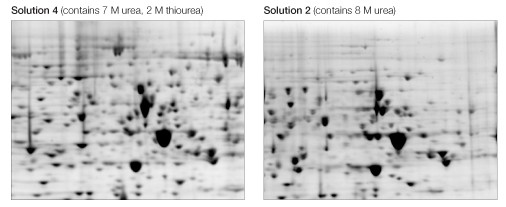
Fig 3. Effect of chaotrope mixture. Equivalent regions from two of the gels in Figure 2 are expanded to show increased protein representation, definition, and resolution as a consequence of the use of a urea/thiourea mixture (left) as opposed to urea alone (right).
The use of CHAPS as the detergent resulted in sharper, more distinct spots than C7BzO in the lower molecular weight, more acidic region of the 2-D gel (Figure 4).
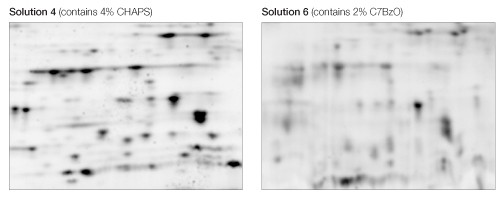
Fig 4. Effect of CHAPS and C7BzO in the sample solution. Equivalent regions from two of the gels in Figure 1 are expanded to show better separation resolution as a consequence of the use of CHAPS (left) as opposed to C7BzO (right).
The use of a higher carrier ampholyte concentration (0.6% Bio-Lyte 3/10 ) resulted in sharper, more distinct spots than did a lower concentration (0.2% Bio-Lyte 3/10 ) (Figure 5).
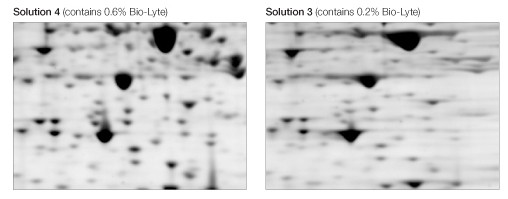
Fig 5. Effect of Bio-Lyte concentration. Equivalent regions from two of the gels in Figure 1 are expanded to show better separation resolution as a consequence of the use of 0.6% Bio-Lyte 3/10 (left) as opposed to 0.2% Bio-Lyte 3/10 (right).
Based on both spot count (Table 3) and general gel appearance (Figures 3–5), solution 4 (7 M urea, 2 M thiourea, 4% CHAPS, 0.6% Bio-Lyte 3/10) was selected as the optimal sample solution.
Effect of IEF protocol
Within the ranges tested, the IEF protocol had no discernable effect on the quality of the resulting 2-D pattern (Figure 6).
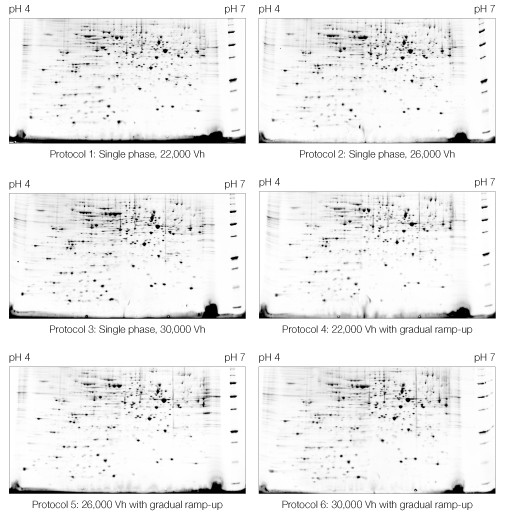
Fig 6. Effect of IEF protocol on 2-D electrophoresis of yeast mitochondrial membrane proteins. IEF protocols described in Table 2 were applied. First dimensions were run on 11 cm pH 4–7 IPG strips. Second dimensions were run on Criterion 8–16% Tris-HCl gels. A representative Oriole-stained gel from each replicate pair is shown.
Discussion and Conclusions
In most cases, the success of a 2-D electrophoresis experiment depends on the ability to resolve as many proteins as possible and to reproducibly detect changes in position or abundance. Optimization of the parameters affecting resolution and reproducibility is therefore often an essential step toward generating a useful experimental result.
The sample tested was an insoluble membrane protein fraction prepared from yeast cells by differential centrifugation. It was enriched in mitochondrial membranes and was therefore expected to contain membrane protein complexes that can be difficult to analyze by electrophoretic methods. The rationale for the variables tested in the composition of the rehydration solution came from literature reports on the ability of various additives to increase the resolution and representation of membrane proteins on 2-D gels. The use of urea-thiourea mixtures, as opposed to urea alone, is reported to result in an increased yield of distinguishable protein spots visible on 2-D gels, particularly when applied to membrane preparations (Rabilloud et al. 1997). Selection of the detergent present during IEF is also reported to influence representation of proteins on 2-D gels. CHAPS is the standard detergent used in 2-D electrophoresis (Görg et al. 2000, Friedman et al. 2009), however C7BzO is a representative of a class of zwitterionic detergents that is reported to provide increased solubilizing power for certain membrane proteins (Rabilloud et al. 1999). Carrier ampholytes have been reported to enhance protein solubility, particularly of membrane proteins, when used during IPG-IEF (Rimpilainen and Righetti 1985), so the effect of an elevated carrier ampholyte concentration was tested as well.
The PROTEAN i12 system was invaluable in allowing rapid determination of optimal focusing conditions for this sample. It allowed effective optimization of the components of the sample solution in a single run. It was determined that the standard composition of
7 M urea, 2 M thiourea, and 4% CHAPS gave the best resolution and spot count. Additionally, it was determined that elevating the concentration of carrier ampholyte used from the standard 0.2% to 0.6% resulted in enhanced resolution and spot count. It also allowed the verification, in a single separate run, of the optimal focusing protocol for this particular sample and sample solution. Optimal results were achieved independently of whether total volt-hours or a phased voltage ramp was applied, and the preprogrammed protocol for the IPG strip length and pH range used was determined to be adequate. In comparison, conducting these experiments using one of the previous generation of commercial first-dimension IEF systems would have required several sequential experiments. As well as requiring considerably more time, this approach can introduce variation through different handling across sequential runs.
References
Arnold I et al. (1998). Yeast mitochondrial F1F0-ATP synthase exists as a dimer: Identification of three dimer-specific subunits. EMBO J 17, 7170–7178.
Friedman D et al. (2009). Isoelectric focusing and two-dimensional gel electrophoresis. Meth Enzymol 463, 515–540.
Görg A et al. (2000). The current state of two-dimensional electrophoresis
with immobilized pH gradients. Electrophoresis 21, 1037–1053.
Rabilloud T et al. (1997). Improvement of the solubilization of proteins in
two-dimensional electrophoresis with immobilized pH gradients. Electrophoresis 18, 307–316.
Rabilloud T et al. (1999). Analysis of membrane proteins by two-dimensional electrophoresis: Comparison of the proteins extracted from normal or Plasmodium falciparum-infected erythrocyte ghosts. Electrophoresis 20, 3603–3610.
Rimpilainen MA and Righetti PG (1985). Membrane protein analysis by isoelectric focusing in immobilized pH gradients. Electrophoresis 6, 419–422.
Excel is a trademark of Microsoft Corporation.