Introduction
Hexapeptide libraries, such as Bio-Rad’s ProteoMiner™ protein enrichment technology, can significantly increase sensitivity of shotgun proteomics analyses of diverse complex samples (Griffin and Bandhakavi 2011, Boschetti and Righetti 2009, Guerrier et al. 2008, Mouton-Barbosa et al. 2010). Underlying this increased sensitivity is the partial removal of high-abundance proteins, leading to an increased representation of low-abundance proteins — a phenomenon described as dynamic range compression (DRC) (Figure 1). Currently, hexapeptide libraries have been mostly used to increase proteomic detection in fluid samples (eg: saliva, plasma, etc.), but not in cellular lysates.
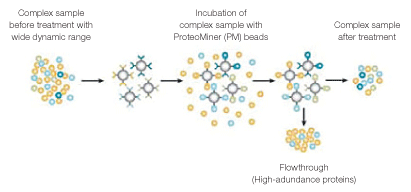
Fig. 1. DRC by hexapeptide libraries (ProteoMiner beads). Treatment of complex samples with ProteoMiner beads results in concentration of low-abundance proteins and partial depletion of high-abundance proteins.
Application of hexapeptide libraries to cellular lysates is challenged by the need to use detergents or chaotropes for cellular lysis. Detergents/chaotropes can interfere with the binding of extracted proteins to hexapeptide library baits (Fonslow et al. 2011, Freeby et al. 2010). Thus, cellular lysis and sample processing conditions need to be optimized for ProteoMiner treatment. Optimal sample processing conditions have the potential to boost shotgun proteomics analyses of cellular proteins, posttranslational modifications, and proteogenomic annotation efforts currently under way.
Here, we used HeLa cells as a starting material to present modified sample processing conditions for ProteoMiner treatment and their incorporation into a workflow for shotgun proteomics analysis. ProteoMiner treatment significantly enhanced proteomic coverage of both soluble and insoluble protein fractions within HeLa cells, thus signaling the appropriateness of ProteoMiner kits for enhancing proteomic coverage of mammalian/human cellular lysates.
Methods
Cell Lysis and ProteoMiner Treatment
One-gram pellets of frozen HeLa cells (Texcell, CC-008; ~5 x 10⁸ cells each) were processed via 4 cycles of freeze-thaw lysis with addition of 9 ml PBS (10 mM sodium phosphate, 150 mM NaCl, pH 7.6, supplemented with protease inhibitors) for each cycle of freeze-thaw. Thawed lysates were pooled and centrifuged at 20,000 x g for 20 min to result in a soluble fraction (supernatant) and insoluble fraction (pellet). Each of these fractions was subsequently processed as detailed below and depicted in Figure 2.
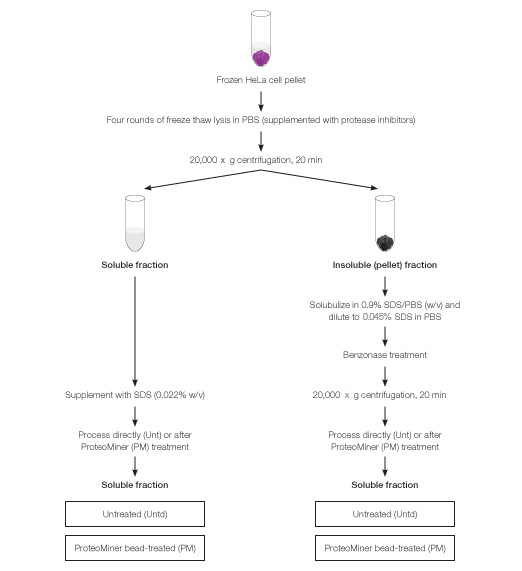
Fig. 2. Biochemical fractionation of HeLa cells and workflow for processing of individual fractions with or without ProteoMiner treatment. ProteoMiner treatment of soluble fraction was done in presence of SDS at 0.022% w/v and of insoluble fraction at 0.045%.
Soluble fraction was supplemented with SDS to 0.022% w/v and processed with or without ProteoMiner treatment. Failure to include SDS in cellular lysates during ProteoMiner treatment resulted in sample cloudiness and aggregation; 0.022% SDS (w/v) was the minimum amount of SDS able to prevent sample cloudiness and aggregation (data not shown).
The insoluble fraction was solubilized in PBS supplemented with SDS at 0.9% (w/v) and diluted 20-fold in PBS (supplemented with protease inhibitors) to result in a final SDS concentration of 0.045% (w/v). To reduce viscosity, 30 ml benzonase (Novagen, 90% purity) was added and sample was incubated at room temperature for 15 min. Finally, the sample was centrifuged at 20,000 x g for 20 min and the clarified supernatant used as the solubilized pellet fraction for processing with or without ProteoMiner treatment.
Samples from solubilized pellet (i.e., proteins from insoluble pellet fraction; 35 mg total protein) and soluble fraction (50 mg protein) were incubated with 100 µl and 200 µl, respectively, pre-rinsed ProteoMiner beads overnight with gentle tumbling in presence of protease inhibitors. ProteoMiner beads were pre-rinsed three times with ten volumes of PBS prior to incubation with protein samples. Subsequently, beads were pelleted by centrifugation for 5 min at 1,500 x g, washed three times in PBS, and bound protein was eluted by boiling beads in a modified elution buffer (100 mM Tris-HCl, pH 6.8, 4% SDS, 10% mercaptoethanol, 20% glycerol (Bandhakavi et al. 2009).
Sample Preparation, SDS-PAGE, and Isoelectric Focusing
Untreated and ProteoMiner bead–treated soluble and insoluble (pellet) fractions were precipitated with four volumes of ice-cold acetone and rinsed twice in ice-cold acetone, then precipitated proteins were solubilized in 1% SDS, 50mM Tris, 5 mM EDTA, pH 8.0. Redissolved protein samples were analyzed by SDS-PAGE or processed for trypsinization followed by peptide purification via Oasis MCX and Sep-Pak cartridges (Waters Corp) (Bandhakavi et al. 2009).
Purified tryptic peptides were either directly routed for LC-MS analysis or fractionated via in-gel IEF (PROTEAN® i12™ IEF system, Bio-Rad Laboratories, Inc.) using ReadyStrip™ 11 cm linear pH 3-10 IPG strips (Bio-Rad). IPG strips were cut into 0.9 cm sections using a razor blade and peptides were eluted sequentially by shaking strip sections for 60 min each in 0.1% trifluoroacetic acid (TFA), followed by 35% acetonitrile/0.1% TFA, and finally 70% acetonitrile/0.1% TFA (Berkelman et al. 2011). Eluates from each fraction were pooled, vacuum dried, and purified by reversed phase (C18 Sep-Pak).
Mass spectrometric analysis
Peptides (2 µg) were dissolved in 5 ml load solvent (98:2:0.01 water/acetonitrile/formic acid) and loaded directly onto a 12 cm x
100 μm fused silica pulled-tip capillary column packed with Magic C18AQ, 5 µm, 200 Å pore size resin (Michrom BioResources, Inc.) at a flow rate of 1100 nl/min. Peptides were eluted using a gradient of 10–40% acetonitrile in 0.1% formic acid over 55 min with a constant flow of 320 nl/min. The column was mounted in a nanospray source directly in line with an LTQ Orbitrap Velos mass spectrometer (Thermo Fisher Scientific).
The orbital trap was set to acquire survey mass spectra (m/z 360–1800) with a resolution of 30,000 at m/z 400 with a target value set to 1E6 ions or 500 ms. The 10 most intense ions from the full scan were selected for fragmentation by collision-induced dissociation (normalized collision energy, 35%) in the Velos ion trap with automatic gain control settings of 10,000 ions or 100 ms concurrent with full-scan acquisition in the orbital trap. For enhanced mass accuracy, the lock mass option was enabled for real-time calibration with polysiloxane peak at 445.1200 m/z. Precursor ion charge state screening was enabled: unassigned and singly charged species were rejected. Dynamic exclusion set to a maximum of 500 entries with a maximum retention period of 30 sec and mass window of –0.7 to 1.25 amu. Data were acquired using Xcalibur software V2.1.0 (Thermo Fisher Scientific).
Spectra were searched by SEQUEST v27 (University of Washington) against a composite 2010 UniProt human protein database containing forward and reverse protein sequences (70,150 total entries). Data were filtered using two tryptic termini, 50% peptide probability, and 10 ppm precursor mass accuracy in Scaffold. Proteins were identified at or below 1% global false discovery rate (FDR), which corresponded to <0.25% peptide level global FDR (Bandhakavi et al. 2009).
Results
In this study, we evaluated the effect of modified cell lysis and sample processing for ProteoMiner treatment of mammalian cellular lysates via shotgun proteomics. Within our evaluation we also determined whether biochemically distinct subcellular proteomes displayed any differences in their suitability for ProteoMiner treatment.
As the first step, HeLa cells were partitioned into a soluble and an insoluble (pellet) fraction (Figure 2). Next, the effect of ProteoMiner treatment on each fraction was evaluated by SDS-PAGE (Figure 3) and shotgun proteomics/MS analysis (Figures 4–8).
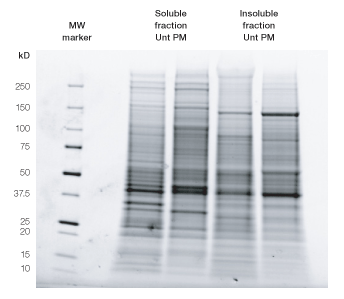
Fig. 3. SDS-PAGE of untreated (Unt) vs. ProteoMiner bead–treated (PM) samples of HeLa soluble and insoluble (pellet) fractions. Equal amounts of proteins from each sample (25 µg) were denatured in equal parts 2x SDS sample buffer and loaded on Criterion Stain Free™ Tris-HCl 8–16% gels (Bio-Rad). Precision Plus Protein™ unstained standards (Bio-Rad) were used as a molecular weight (MW) marker in first lane. After electrophoresis, proteins were visualized by 5 min gel activation using a Gel Doc™ EZ imager (Bio-Rad).
For initial mass spectrometric (MS) analysis, 10 µg protein from untreated and Proteominer bead–treated samples (soluble fraction: untreated and ProteoMiner-treated; insoluble fraction: untreated and ProteoMiner-treated) were digested with trypsin and peptides purified using C18 cartridges. Equal amounts of peptides from each sample were analyzed in two replicate runs by 1-D LC-MS, wherein peptides were fractionated by reversed phase/C18 prior to MS analysis, and proteins identified at <1% global FDR (Figure 4).
For both soluble and insoluble fractions, ProteoMiner treatment yielded comparable numbers of protein identifications relative to untreated samples. However, ProteoMiner treatment yielded unique protein identifications not otherwise detected in untreated samples. Thus, ProteoMiner treatment significantly increased total protein identifications in both cellular fractions (Figure 4).
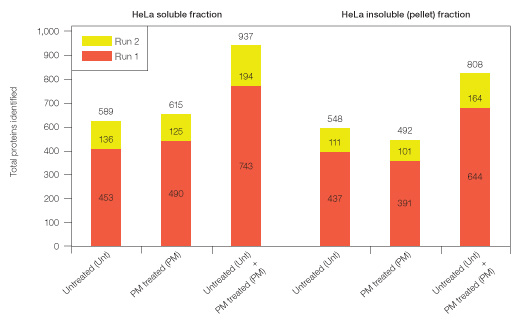
Fig. 4. Total proteins identified (at <1% global FDR) from identical replicate runs of unfractionated, purified tryptic digests from HeLa soluble and insoluble (pellet) fractions (Unt, PM–treated, and Unt + PM treated combined, respectively).
Next, we sought to more rigorously test the ProteoMiner system’s ability to enhance identification of unique proteins in HeLa cellular fractions. As proof of principle, we expanded our proteomic analysis of the soluble fraction, before and after ProteoMiner treatment, using a “condensed” 2D-fractionation platform, as described below (Figure 5).
Purified tryptic peptides derived from untreated and ProteoMiner bead–treated soluble fractions, 90 µg of protein from each, were fractionated “in-gel” using the PROTEAN i12 IEF system (Berkelman et al. 2011). Fractions expected to be “peptide-sparse” were pooled prior to analysis by 1-D LC-MS. Owing to the addition of IEF and pooling of peptide-sparse isoelectric fractions prior to 1-D LC-MS, we refer to this workflow as a condensed 2-D peptide fractionation platform (Figure 5).
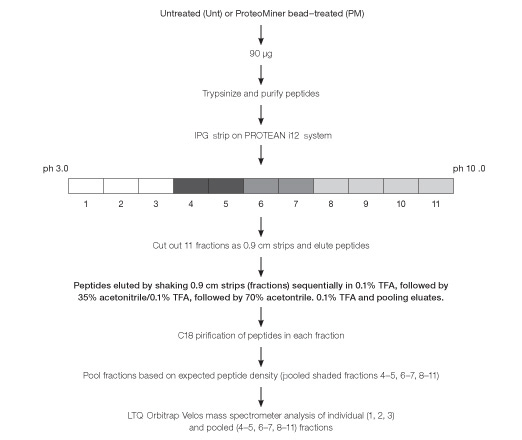
Fig. 5. Workflow used for peptide fractionation using in-gel IEF and processing for mass spectrometric analysis of Untreated (Unt) and ProteoMiner bead–treated (PM) HeLa soluble fraction.
Our condensed 2-D peptide fractionation platform yielded ~3.5-fold more protein identifications than 1-D fractionation alone (see proteins identified from either untreated or Proteominer bead–treated soluble fractions in Figure 4 versus Figure 6). After replicate analyses of each fraction, 2,084 total proteins were identified in untreated and 2,131 total proteins in ProteoMiner bead–treated sample. Thus, the condensed 2-D fractionation platform described here effectively expands proteomic analysis of a complex mixture such as HeLa soluble fraction.
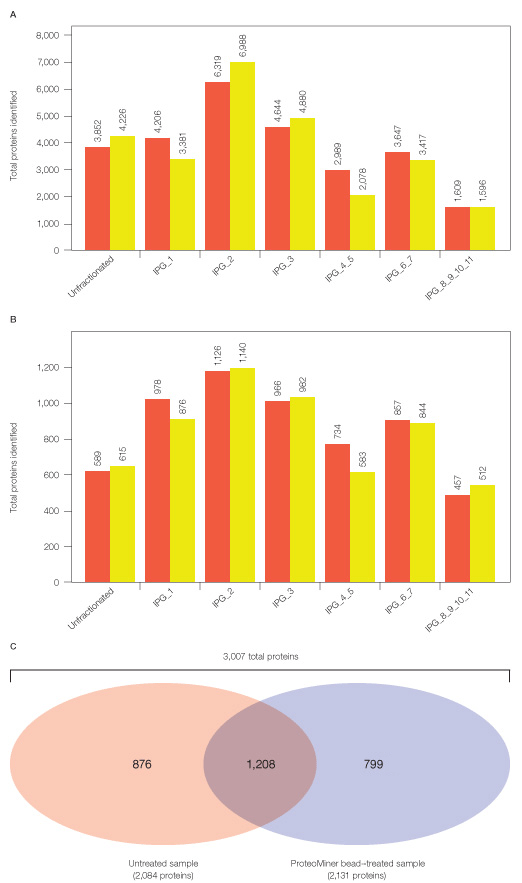
Fig. 6. Total peptides and proteins identified after MS analysis of Untreated and ProteoMiner bead–treated samples from HeLa soluble fraction. Approximately similar numbers of peptides and proteins were identified in replicate analyses of unfractionated and IPG strip fractions of tryptic peptides corresponding to untreated (![]() ) and ProteoMiner bead–treated
) and ProteoMiner bead–treated
(![]() ) samples (A and B). After combining all analyses of untreated and ProteoMiner bead–treated samples, ProteoMiner treatment yielded 923 unique additional proteins not identified in untreated sample (C). All peptide identifications were below 0.25% FDR and protein identifications below 1% global FDR.
) samples (A and B). After combining all analyses of untreated and ProteoMiner bead–treated samples, ProteoMiner treatment yielded 923 unique additional proteins not identified in untreated sample (C). All peptide identifications were below 0.25% FDR and protein identifications below 1% global FDR.
Even after expanded proteomic analysis, ProteoMiner treatment yielded unique identifications not found in the untreated HeLa soluble sample (Figures 6 and 7). 2,084 proteins were identified from analysis of the untreated sample alone; 3,007 total proteins were identified from the combination of Untreated and ProteoMiner bead–treated sample analyses. 923/3,007 proteins were identified only after ProteoMiner treatment.
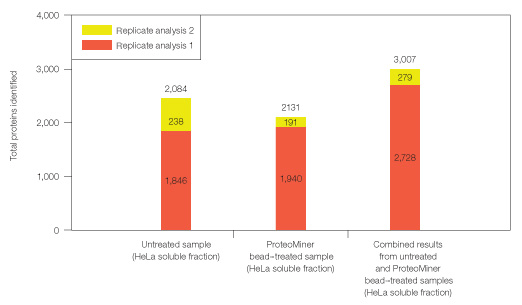
Fig. 7. Combining results from analysis of untreated and ProteoMiner bead–treated samples. Results show significantly more identifiable proteins in HeLa soluble fraction than a simple replicate analysis of untreated sample.
Finally, we used Gene Ontology analysis to determine if the unique protein identifications from the ProteoMiner bead–treated sample might correspond to unique subcellular localizations. As shown in Figure 8, membrane, mitochondrial, and extracellular proteins were underrepresented in the untreated sample (14% of all identified proteins). A likely basis for this underrepresentation is the relatively low abundance of proteins from these subcellular localizations within the soluble fraction.
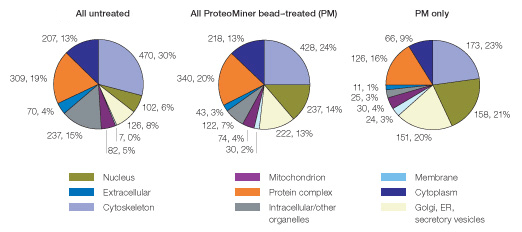
Fig. 8. Proteins identified uniquely after ProteoMiner treatment of HeLa soluble fraction display a distinct Gene Ontological/subcellular distribution profile. Note the relative underrepresentation of mitochondrial, membrane, and extracellular proteins (14% all three categories combined) versus their increased representation in proteins identified uniquely after ProteoMiner treatment (PM only; 44% all three categories combined).
Interestingly, ProteoMiner treatment enhanced identification of such underrepresented proteins. Proteins from membrane, mitochondrial, and extracellular locations represented 29% of all proteins identified in the ProteoMiner treated sample and 44% of proteins uniquely identified after ProteoMiner treatment). Thus, ProteoMiner treatment increased detection of putatively low-abundance proteins in human cellular lysates.
Conclusions
A robust workflow is presented for ProteoMiner treatment of human/mammalian cellular lysates and subsequent analysis by shotgun proteomics analysis.
As part of this workflow, we describe a condensed 2-D peptide fractionation platform comprising in-gel IEF on the PROTEAN i12 system followed by reversed phase fractionation in line with an LTQ Orbitrap Velos mass spectrometer that increased identifiable proteins ~3.5 fold.
Combined analysis of untreated and ProteoMiner bead–treated fractions (soluble and insoluble) of HeLa cells leads to a significantly more comprehensive coverage of each fraction than is achieved by replicate analyses of untreated fractions.
A significant number of proteins uniquely identified by ProteoMiner treatment correspond to putatively low-abundance proteins.
ProteoMiner treatment is an attractive option for increasing proteomic coverage of mammalian/human cellular lysates and unmasking proteins from categories that are underrepresented in cellular lysates.
References
Bandhakavi S et al. (2009). A dynamic range compression and three-dimensional peptide fractionation analysis platform expands proteome coverage and the diagnostic potential of whole saliva. J Proteome Res 8, 5590–5600.
Berkelman T et al. (2011). Use of the PROTEAN 12 IEF System for In-Gel Peptide Fractionation Prior to LC-MS and Comparison with Off-Gel Fractionation. Bio-Rad Bulletin 6140.
Boschetti E and Righetti PG (2009). The art of observing rare protein species in proteomes with peptide ligand libraries. Proteomics 9, 1492–1510.
Fonslow BR et al. (2011). Improvements in proteomic metrics of low abundance proteins through proteome equalization using proteominer prior to MudPIT. J Proteome Res 10, 3690–3700.
Freeby S et al. (2010 ). Enrichment of Medium- and Low-Abundance Proteins in Sample Types Using ProteoMiner Technology. Bio-Rad Bulletin 5916
Griffin TJ and Bandhakavi S (2011). Dynamic range compression: a solution for proteomic biomarker discovery? Bioanalysis 3, 2053–2056.
Guerrier L et al. (2008). Reduction of dynamic protein concentration range of biological extracts for the discovery of low-abundance proteins by means of hexapeptide ligand library. Nat Protoc 3, 883–890.
Mouton-Barbosa E et al. (2010) In-depth exploration of cerebrospinal fluid by combining peptide ligand library treatment and label-free protein quantification. Mol Cell Proteomics 9, 1006–1021.
Acknowledgements
We thank LeeAnn Higgins and members of the University of Minnesota’s mass spectrometry facility for performing mass spectrometry analyses, and Getiria Onsongo, from the Masonic Cancer Center’s Biostatistics and Bioinformatics Core facility, for performing Gene Ontology analyses. We also thank Kiranjot Kaur for her excellent technical support.
Author for correspondence:
sri_bandhakavi@bio-rad.com.
Oasis and Sep-Pak are trademarks of the Waters Corporation. LTQ Orbitrap and Xcalibur are trademarks of Thermo Fisher Scientific. SEQUEST is a trademark of the University of Washington. Precision Plus Protein standards are sold under license from Life Technologies Corporation, Carlsbad, CA, for use only by the buyer of the product. The buyer is not authorized to sell or resell this product or its components.