The separation of proteolytically digested samples by reversed-phase liquid chromatography coupled to mass spectrometry (LC-MS) with electrospray ionization is a powerful and widely used technique for proteomic analysis. It can detect thousands of individual peptides, and by referencing a database, identify their proteins of origin. This “bottom-up,” or “shotgun” approach is very useful for profiling proteins present in a biological sample (Zhang et al. 2010). Additional depth of coverage can be obtained by preceding LC-MS with an orthogonal upstream fractionation (Motoyama and Yates 2008) that generates fractions of lower complexity that are analyzed separately. Orthogonal separation techniques that are used for this purpose include strong cation exchange chromatography (SCX) (Peng et al. 2003), hydrophilic interaction chromatography (HILIC) (McNulty and Annan 2008), and isoelectric focusing (IEF) (Moritz et al. 2004, Cargile et al. 2005, Malmström et al. 2006, Hörth et al. 2006). The depth of proteome coverage reached with IEF can be greater than that obtained with chromatographic methods (Essader et al. 2005, Gan et al. 2005), making IEF a widely used technique for this application. IEF has the additional benefit of providing a search constraint for peptide identification, since the isoelectric point (pI) of a peptide can be predicted directly from its sequence (Xie et al. 2005, Cargile et al. 2004, Krijgsveld et al. 2006). IEF fractionation of sample digests is predominantly performed using immobilized pH gradient strips due to the reproducibility and versatility afforded by commercial IPG strips.
An IEF separation with IPG strips may be performed in an “off-gel” mode, in which the digest is electrophoretically fractionated through a series of sample cups placed in contact with an IPG gel (Geiser et al. 2011a), or in an “in-gel” mode, in which the digest is loaded into an IPG gel and separated within the gel matrix (Cargile et al. 2004, Gan et al. 2005, Scherl et al. 2006, Krijgsveld et al. 2006, Chick et al. 2008, Geiser et al. 2011b). Off-gel separated peptides are recovered in solution directly from the sample cups, whereas in-gel separated peptides must be eluted from excised sections of IPG gel. Off-gel separations require a dedicated instrument while in-gel separations may be performed with any instrument capable of performing IEF on IPG strips.
This study compares the two methods in terms of overall speed and simplicity of the workflow, resolution of the separation, and depth of proteome coverage provided. The off-gel separation was performed using an Agilent 3100 OFFGEL fractionator and the in-gel separation with the PROTEAN i12 IEF system (Bio-Rad Laboratories, Inc). To ensure a valid comparison, the separations were conducted using ReadyStrip™ IPG strips of the same length and pH range, and the fractions collected from both separations corresponded to identical pH range increments.
Materials and Methods
Materials
Reagents used were from Bio-Rad or Sigma-Aldrich except when indicated. Lys-C (lysyl endopeptidase) was purchased from Wako Chemicals USA. Trypsin was purchased from Promega Corporation. Empore solid phase extraction cartridges and solid phase extraction disks were purchased from VWR. Trifluoroacetic acid (TFA) was purchased from Thermo Fisher Scientific.
General
Clean technique was practiced throughout in order to minimize keratin contamination. Solutions containing urea or enzyme were prepared immediately before use.
Sample Preparation
Lysate preparation — HeLa cells were grown in 10 cm plates to a density of approximately 3 × 10⁶ cells per plate. After washing three times with cold phosphate-buffered saline, cell pellets were flash frozen and stored at –80°C. Approximately 2.4 × 10⁷ cells were suspended in 640 µl of a lysis solution consisting of 8 M urea and 50 mM Tris-HCl pH 8.0. The lystate was sonicated briefly and clarified by centrifugation (20,000 × g, 5 min). The protein concentration of this material was determined to be 11.3 mg/ml by the DC™ protein assay (Bio-Rad) using IgG as a standard.
Reduction and alkylation — a portion of the HeLa cell lysate containing 2 mg protein (177 µl) was combined with 200 µl of 8 M urea, 50 mM Tris-HCl pH 8.0, and 6.4 µl of 1.2 M dithiothreitol (DTT) to give a protein concentration of 5.2 mg/ml and a DTT concentration of 20 mM. Following reduction at 20°C for 1 hr, the mixture was alkylated by the addition of 77 µl of 600 mM iodoacetamide in 8 M urea and 50 mM Tris-HCl pH 8.0 (the final iodoacetamide concentration was 100 mM). Alkylation was carried out for 30 min at 20°C.
Digestion — a two-step digestion was employed utilizing Lys-C at an enzyme to protein ratio of 1:50 followed by trypsin at an enzyme to protein ratio of 1:100. A solution of Lys-C was prepared by dissolving 40 µg of Lys-C in 613 µl of 8 M urea and 50 mM Tris-HCl pH 8.0. This was mixed with the entire reduced and alkylated sample. Lys-C digestion proceeded overnight at 20°C. Trypsin (20 µg), diluted into 3.22 ml of 50 mM ammonium bicarbonate, was added to the Lys-C digest and incubated at 20°C for an additional 4 hr.
Desalting and concentration — the sample was split among four 3 ml Empore C18 solid phase extraction cartridges for desalting. Each cartridge was placed in a 15 ml conical centrifuge tube. Prior to application of the sample, the cartridges were equilibrated first with 1 ml of methanol followed by 0.5 ml of 0.1% TFA, 70% acetonitrile, and 0.5 ml of 0.1% TFA in water. Each solution was drawn through the cartridge by centrifugation (1500 × g for 1 min in a fixed-angle rotor). Approximately 1.1 ml of sample digest was applied to each cartridge and centrifuged for 10 min at 135 × g. The cartridges were washed three times with 0.5 ml 0.1% TFA, drawing the solution through the cartridge each time by centrifugation (10 min at 135 × g). The peptides were eluted with 0.5 ml of 0.1% TFA in 70% acetonitrile, centrifuging as before. A second elution was performed and all eluates were pooled, yielding a total volume of 4 ml. The yield was estimated by A280 to be 525 µg, assuming that a 1 mg/ml protein solution has an absorbance at 280 nm of 1.1. The sample was aliquoted and dried by vacuum centrifugation.
Off-Gel Fractionation
Off-gel fractionation was conducted on 11 cm pH 3–10 ReadyStrip IPG strips (Bio-Rad) using the OFFGEL Fractionator. The 12-well OFFGEL frame was modified by removal of a single sample cup in order to accommodate an 11 cm IPG strip. For each IPG strip, 52.5 µg of sample was dissolved in 1.65 ml of 1x peptide OFFGEL solution prepared as directed from components in the reagent kit supplied for use with the OFFGEL fractionator. The sample was loaded and run as directed employing the default method for separation of peptides using the 12-well frame (20,000 Vh with voltage and current limits of 4,500 V and 50 µA, respectively). Following separation, the fractions were recovered from the sample wells and concentrated by vacuum centrifugation (the fractions did not fully dry due to the presence of glycerol in the peptide OFFGEL solution).
In-Gel Fractionation and Peptide Elution
For each 11 cm pH 3–10 ReadyStrip IPG strip (Bio-Rad), 52.5 µg of sample was dissolved in 200 µl of 8 M urea, 0.2% (w/v) Bio-Lyte® 3/10 ampholytes. The sample was loaded onto the IPG strip by overnight rehydration in a sample tray. Each IPG strip was subjected to IEF in the PROTEAN i12 IEF cell according to the following protocol: 500 V for 30 min, 1,000 V for 30 min, linear ramp to 8,000 V over 1 hr followed by 8,000 V for 6 hr. A current limit of 50 µA was held throughout. IEF was conducted in the gel-side up configuration with moist electrode wicks covering approximately 5 mm of both ends of the IPG strip. Following electrophoresis, each IPG strip was rinsed briefly in a beaker of hexane to remove oil. A cutting template consisting of 12 parallel 1 cm lines placed 9 mm apart was printed and placed under a clean sheet of glass. Each IPG strip was placed gel-side up on the glass over the template as indicated in Figure 1 and the gel was cut over each line with a razor blade, using a fresh blade for each cut, generating twelve 9 mm gel sections. Each section was placed in a 1.5 ml tube and the 5 mm gel ends (the sites of electrode wick contact) were discarded.
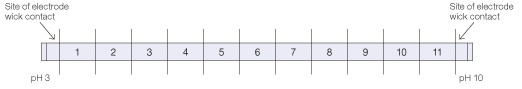
Fig 1. Template for cutting IPG strips to generate IEF fractions.Each IPG strip was placed on a clean sheet of glass over a template comprising 12 parallel 1 cm lines placed 9 mm apart so that the ends of the IPG gel extended 5 mm beyond the outermost lines. The IPG strip was cut over each line. Fraction numbers are indicated.
Peptides were eluted sequentially with 150 µl of 0.1% TFA in water, 0.1% TFA in 35% acetonitrile, 0.1% TFA in 70% acetonitrile. Each elution was carried out for 1.5 hr with gentle shaking. All three eluates from each fraction were pooled and dried by vacuum centrifugation.
Solid Phase Extraction Cleanup
Both the off-gel and the in-gel fractions were dissolved in 180 µl of 0.1% TFA and applied to a modified solid phase extraction procedure to remove carrier ampholytes and other components of the IEF solution (Rappsilber et al. 2003). The solid phase extraction cartridges were prepared with reversed-phase material cut from an Empore SDB-XC (styrene-divinylbenzene) solid phase extraction disk. A 17 gauge blunt-ended needle was used to prepare small plugs of material, which were packed into 200 µl pipet tips (three per tip). Each packed tip was placed in a 1.5 ml centrifuge tube through a hole bored in its lid. Prior to sample application, each cartridge was equilibrated with 90 µl of 0.1% TFA, which was washed through by centrifugation for 1 min at 1000 × g. Half of each sample (90 µl) was applied to the cartridge, which was then centrifuged at 110 × g for 10 min. Bound peptides were washed with 90 µl of 0.1% TFA by centrifugation as before. The wash was discarded and peptides were eluted with 90 µl of 0.1% TFA, 80% acetonitrile by centrifugation as before. The eluted fractions were dried by vacuum centrifugation.
LC-MS/MS
Each desalted and dried fraction from both separations was dissolved in 10 µl of 0.1% formic acid, 2% acetonitrile for analysis. A portion of the unfractionated digest (2 µg) was similarly prepared. Half of each sample was analyzed by LC-MS/MS as previously described (Bandhakavi et al. 2009). The material was loaded directly onto a 13 cm × 100 µm fused silica pulled-tip capillary column packed with Magic C18AQ 5 µm, 200 Å pore-size resin (Bruker-Michrom) with load buffer at a flow rate of 1000 nl/min using an Eksigent 1DLC nanoflow system and a MicroAS autosampler. Peptides were eluted using a gradient of 2–40% acetonitrile in 0.1% formic acid over 90 min with a constant flow of 250 nl/min. The column was mounted in a nanospray source directly in line with an LTQ Orbitrap XL mass spectrometer (Thermo Fisher Scientific). The spray voltage was applied at 1.75 kV, and the heated capillary was maintained at 160°C. The orbital trap was set to acquire survey mass spectra (m/z 360–1,800) with a resolution of 60,000 at m/z 400 with a target value set to 106 ions or 500 ms. The eight most intense ions from the full scan were selected for fragmentation by collision-induced dissociation (normalized collision energy, 35%) in the LTQ ion trap with automatic gain control settings of 5,000 ions or 100 ms concurrent to full-scan acquisition in the orbital trap. For enhanced mass accuracy, the lock mass option was enabled for real-time calibration using the polysiloxane peaks of m/z 371.1012, 445.1200, and 519.1388. Screening of precursor ion charge state was enabled, and all unassigned charge states, as well as singly charged species, were rejected. Dynamic exclusion was set to a maximum of 500 entries with a maximum retention period of 90 sec and mass window of –0.6 to 1.2 amu. Data were acquired using Xcalibur software.
Database Searching and Data Processing
Data generated from the LC-MS/MS analysis were searched with Sequest V27.0 against a composite UniProt Homo sapiens database with reversed sequences appended (080310 version, 70,150 total entries). Search parameters used were partial tryptic digestion, methionine oxidation (+15.9949 Da) on methionine, and carboxamidomethylation of cysteine (+57.0215 Da). Sequest output was organized and peptide probabilities were calculated through PeptideProphet using Scaffold. Peptide identifications were filtered using full tryptic-digest specificity and a precursor mass tolerance of <10 ppm. False discovery rate at the protein and peptide levels was measured using the formula: FDR = 100 × [Reverse database matches/(Reverse database matches + Forward database matches)]. The pI of each identified peptide was estimated using the Compute pI tool located on the ExPASy Proteomics Server, which uses a method described previously (Bjellqvist et al. 1993).
Results
Separation Profiles and Time Required for Separation
Typical voltage profiles for off-gel and in-gel peptide separations are shown in Figure 2. At the current limit of 50 µA used for both separations, the in-gel separation reached a steady-state voltage of approximately 3,800 V within two hours, whereas the voltage of the off-gel separation never exceeded 1,100 V. As a consequence, the off-gel separation required nearly 24 hours to accumulate the recommended 20,000 Vh for separation, whereas the in-gel separation had accumulated 26,000 Vh within eight hours of running.
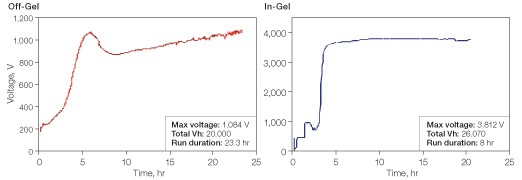
Fig 2. Voltage profiles for off-gel and in-gel peptide separations. A HeLa cell digest was separated on 11 cm pH 3–10 IPG strips. The current limit for both separations was 50 µA per IPG strip. The off-gel separation was performed on the OFFGEL fractionator. The in-gel separation was performed on the PROTEAN i12 IEF cell.
LC-MS/MS Analysis
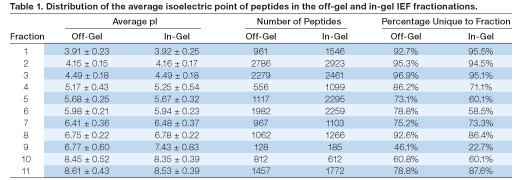
Isoelectric point distribution of IEF-separated peptides — the average pI of the peptides identified in each fraction and the standard deviation of the average pI were very similar between the two fractionation methods (Figure 3).
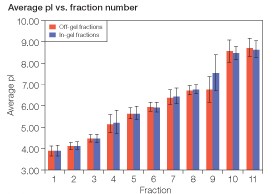
Fig 3. Comparison of the average pI of peptides found in each fraction between off-gel and in-gel fractionation. The isoelectric point of each identified peptide was calculated from the peptide sequence using the Compute pI/MW tool on the ExPASy server (www.expasy.org) and averaged within each fraction. Error bars show the standard deviation within each fraction.
Distribution of peptides among IEF fractions — similar to other studies employing IEF of tryptic digests of complex samples (Cargile et al. 2004, Chick et al. 2008, Hörth et al. 2006, Krijgsveld et al. 2006), the distribution of peptides across the pH gradient was not uniform (Figure 4). In terms of peptide identifications, fractions 1, 2, and 3 were the most abundant while fractions 9 and 10 were notably depleted in peptides. As shown in Figure 4, in-gel fractionation resulted in increased peptide identifications across all fractions except fraction 10. With the exception of fraction 9, most of the peptides found in each fraction were unique to a single fraction in both separations (Figure 4, Table 1). The overall percentage of peptides restricted to a single fraction was 92.8% with the off-gel separation and 90.0% with the in-gel separation.
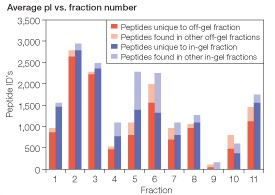
Fig 4. Peptide distribution across off-gel and in-gel separations. The number of peptides identified in each IEF fraction is indicated. ![]() , off-gel separation;
, off-gel separation; ![]() , in-gel separation;
, in-gel separation; ![]() and
and ![]() peptides not restricted to a single fraction.
peptides not restricted to a single fraction.
Overall peptide and protein identification results — prior to peptide fractionation, 1 µg of the unfractionated HeLa cell digested sample was analyzed by LC-MS as a quality check for digestion and post-digestion cleanup. From a single one-hour analysis, 2,932 peptides were identified at high confidence (peptide level false discovery rate of 0.034%) corresponding to 972 proteins (protein level false discovery rate of 0.103%). Having thus confirmed high sample quality, 52.5 µg of this material was processed through either in-gel or off-gel fractionation as described. From the off-gel experiment, 12,954 peptides were identified, corresponding to 3,247 proteins. From the in-gel experiment, 15,483 peptides were identified, corresponding to 3,692 proteins.
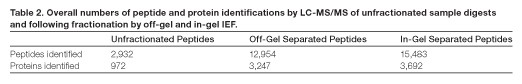
The peptide-level false discovery rate was less than 0.05% and the protein-level false discovery rate was less than 0.45% for both experiments. These results are summarized in Table 2 and represent an increase of 19.4% in peptide identifications and 13.7% in protein identifications achieved through the use of in-gel separation over off-gel separation. Interestingly, both in-gel and off-gel fractionations resulted in a significant number of unique peptide identifications (Figure 5).
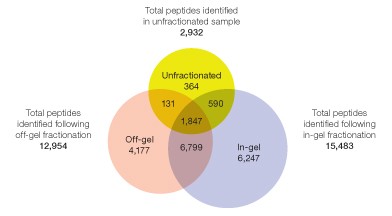
Fig 5. Distribution of identified peptides among the unfractionated digests and following off-gel and in-gel IEF fractionation.
Discussion and Conclusions
When the IEF separation is run using a current limit of 50 µA per IPG strip, an off-gel separation runs at a considerably lower voltage than an equivalent in-gel separation. Peptide separations with equivalent volt-hours can therefore be run more rapidly in-gel. This may be because the volume of solution across which voltage is applied is several-fold higher in the off-gel separation and the conductivity of the system is correspondingly higher. In-gel separations require additional time for peptide elution (in this case, 4.5 hr), compensating somewhat for more rapid separations.
Qualitatively, the two separations gave very similar results both in the average pI and pI range of the peptides in the individual fractions and in the relative abundance of peptides between fractions. This is consistent with the fact that the separations were done using the same IPG strip and that the fractions corresponded to the same 9 mm sections of the pH gradient. However, the close correspondence between the two fractionation methods in the average pI of the peptides found in each fraction was not necessarily to be expected. The presence of urea is reported to modify the pK values both of ionizable amino acid residues and the immobilized buffers present in the IPG gel (Gianazza et al. 1983, Bjellqvist et al. 1993). The off-gel separation was conducted, as recommended, in the absence of urea, whereas the in-gel separation was conducted in 8 M urea. Focusing behavior would be expected to differ between these two conditions.
The percentage of peptides whose identification was restricted to a single IEF fraction was similar between the off-gel and in-gel fractionations. Taken as a metric of separation resolution, this indicates similar resolving power for the two techniques. In spite of the similar resolving power of the two methods, in-gel fractionation provided a greater yield of peptide identifications across almost all fractions. Among the possible reasons for this observation is the fact that peptide recovery from off-gel electrophoresis relies on diffusion of the peptides out in the gel matrix during IEF. Peptides with a tendency to remain within the gel matrix — through ionic, hydrophobic, or other interactions with the immobilized buffers — would be less likely to be recovered in the sample cups following separation. The method employed here for elution of in-gel separated peptides is more stringent and may be responsible for the higher peptide yield.
In addition to higher peptide yields and potentially faster fractionation times, in-gel separations offer several advantages over off-gel separations. In-gel instrumentation allows greater flexibility in the selection of IPG strip length and pH range. There is also no restriction with in-gel separations on the proportion of the length of IPG strip represented by each fraction. An off-gel fraction, by necessity, represents a section of the gel corresponding to the footprint of a single sample cup, approximately 9 mm. The pH range of an in-gel separation is determined by the spacing of the cuts made. The number of fractions generated can therefore be tailored more closely to the needs of the experimenter. As noted above, the distribution of peptide pI is variable across the pH scale. It can be advantageous to cut the IPG strip into sections of variable length such that each eluted fraction contains a similar number of peptides, thereby taking full advantage of the downstream analysis methodology (Vaezzadeh et al. 2008). This strategy is not possible with off-gel IEF. Furthermore, the design of the PROTEAN i12 IEF cell, which controls voltage and current to each IPG strip independently, also allows multiple pH ranges or samples of differing conductivity to be run simultaneously.
References
Bandhakavi S et al. (2009). A dynamic range compression and three-dimensional peptide fractionation analysis platform expands proteome coverage and the diagnostic potential of whole saliva. J Proteome Res 8, 5590–5600.
Bjellqvist B et al. (1993). The focusing positions of polypeptides in immobilized pH gradients can be predicted from their amino acid sequences. Electrophoresis 14, 1023–1031.
Cargile BJ et al. (2004). Gel based isoelectric focusing of peptides and the utility of isoelectric point in protein identification. J Proteome Res 3, 112–119.
Cargile BJ et al. (2005). Immobilized pH gradient isoelectric focusing as a first-dimension separation in shotgun proteomics. J Biomol Tech 16, 181–189.
Chick JM et al. (2008). Characterization of the rat liver membrane proteome using peptide immobilized pH gradient isoelectric focusing. J Proteome Res 7, 1036–1045.
Essader AS et al. (2005). A comparison of immobilized pH gradient isoelectric focusing and strong-cation-exchange chromatography as a first dimension in shotgun proteomics. Proteomics 5, 24–34.
Gan CS et al. (2005). Comparison of protein and peptide prefractionation methods for the shotgun proteomic analysis of Synechocystis sp. PCC 6803. Proteomics 5, 2468–2478.
Geiser L et al. (2011a). Shotgun proteomics: A relative quantitative approach using off-gel electrophoresis and LC-MS/MS. Meth Mol Biol 681, 459–472.
Geiser L et al. (2011b). Shotgun proteomics: A qualitative approach applying isoelectric focusing on immobilized pH gradient and LC-MS/MS. Meth Mol Biol 681, 449–458.
Gianazza E et al. (1983). Isoelectric focusing in immobilized pH gradients in presence of urea and neutral detergents. Electrophoresis 4, 321–326. Hörth P et al. (2006). Efficient fractionation and improved protein identification by peptide OFFGEL electrophoresis. Mol Cell Proteomics 5, 1968–1974.
Hörth P et al. (2006). Efficient fractionation and improved protein identification by peptide OFFGEL electrophoresis. Mol Cell Proteomics 5, 1968–1974.
Krijgsveld J et al. (2006). In-gel isoelectric focusing of peptides as a tool for improved protein identification. J Proteome Res 5, 1721–1730.
McNulty DE and Annan RS (2008). Hydrophilic interaction chromatography reduces the complexity of the phosphoproteome and improves global phosphopeptide isolation and detection. Mol Cell Proteomics 7, 971–980.
Malmström J et al. (2006). Optimized peptide separation and identification for mass spectrometry based proteomics via free-flow electrophoresis. J Proteome Res 5, 2241–2249.
Moritz RL et al. (2004). A proteome strategy for fractionating proteins and peptides using continuous free-flow electrophoresis coupled off-line to reversed-phase high-performance liquid chromatography. Anal Chem 76, 4811–4824.
Motoyama A and Yates JRI (2008). Multidimensional LC separations in shotgun proteomics. Anal Chem 80, 7187–7193.
Peng J et al. (2003). Evaluation of multidimensional chromatography coupled with tandem mass spectrometry (LC/LC–MS/MS) for large-scale protein analysis: The yeast proteome. J Proteome Res 2, 43–50.
Rappsilber J et al. (2003). Stop and go extraction tips for matrix-assisted laser desorption/ionization, nanoelectrospray, and LC/MS sample pretreatment in proteomics. Anal Chem 75, 663–670.
Scherl A et al. (2006). Exploring glycopeptide-resistance in Staphylococcus aureus: A combined proteomics and transcriptomics approach for the identification of resistance-related markers. BMC Genom 7, 296–311.
Vaezzadeh AR et al. (2008). pICarver: A software tool and strategy for peptides isoelectric focusing. J Proteome Res 7, 4336–4345.
Xie H et al. (2005). Evaluating preparative isoelectric focusing of complex peptide mixtures for tandem mass spectrometry-based proteomics: A case study in profiling chromatin-enriched subcellular fractions in Saccharomyces cerevisiae. Anal Chem 77, 3198–3207.
Zhang X et al. (2010). Multi-dimensional liquid chromatography in proteomics. Anal Chim Acta 664, 101–113.
Empore is a trademark of 3M. OFFGEL is a trademark of Agilent Technologies. MicroAS is a trademark of Thermo Fisher Scientific. Orbitrap is a trademark of ThermoFisher Scientific. Xcalibur is a trademark of Thermo Scientific. PeptideProphet is a registered trademark of the Institute for Systems Biology. Scaffold is a trademark of Proteome Software, Inc.