Introduction
Quantitative real-time PCR is one of the most important methods for rapid and reliable quantification of gene expression. In order to perform an accurate analysis of relative gene expression in different samples, tissues, or experimental conditions, reference genes must be used to normalize variation across all samples. While the importance of choosing the appropriate reference genes has been widely recognized, researchers often rely on knowledge over experience and often simply choose to use classical reference genes (GAPDH, B2M, ACTB, TBP, and the like). Although these commonly used reference genes may be stable in many situations, it has been observed that their expression can vary considerably depending on species, genotype, developmental stage, experimental treatment, or circadian rhythm (Jain et al. 2018, Lacerda et al. 2014, Radonic et al. 2004). Additionally, reference genes reported in the literature for a particular sample type should be validated experimentally prior to use. Some sources of variability that must be included in the reference gene stability survey include sample type and treatment(s). Other experimental sources of variability can be minimized by making sure to harvest cells, prepare and quantitate RNA, and synthesize cDNA using the same methods and reagents. It is important to evaluate several reference genes and select only those that are stably expressed across all samples and sets of conditions. Use of multiple stably expressed reference genes for normalization can further reduce gene expression (Vandesompele et al. 2002).
Predesigned panels of reference gene assays offer a convenient option for surveying the stability of a number of commonly used reference genes at the same time and across all samples. PrimePCR Reference Gene Panels are offered in both 96- and 384-well formats, for human, mouse, and rat. Thirty of the most widely reported reference genes, spanning many functional pathways (REF), are included on the 384-well layout, in triplicate, for up to four samples. The 96-well layout has fourteen assays in triplicate and can accommodate up to two samples. Combined, the 96 and Plus 96 Panels cover the top 28 reference genes (Figure 1).
A
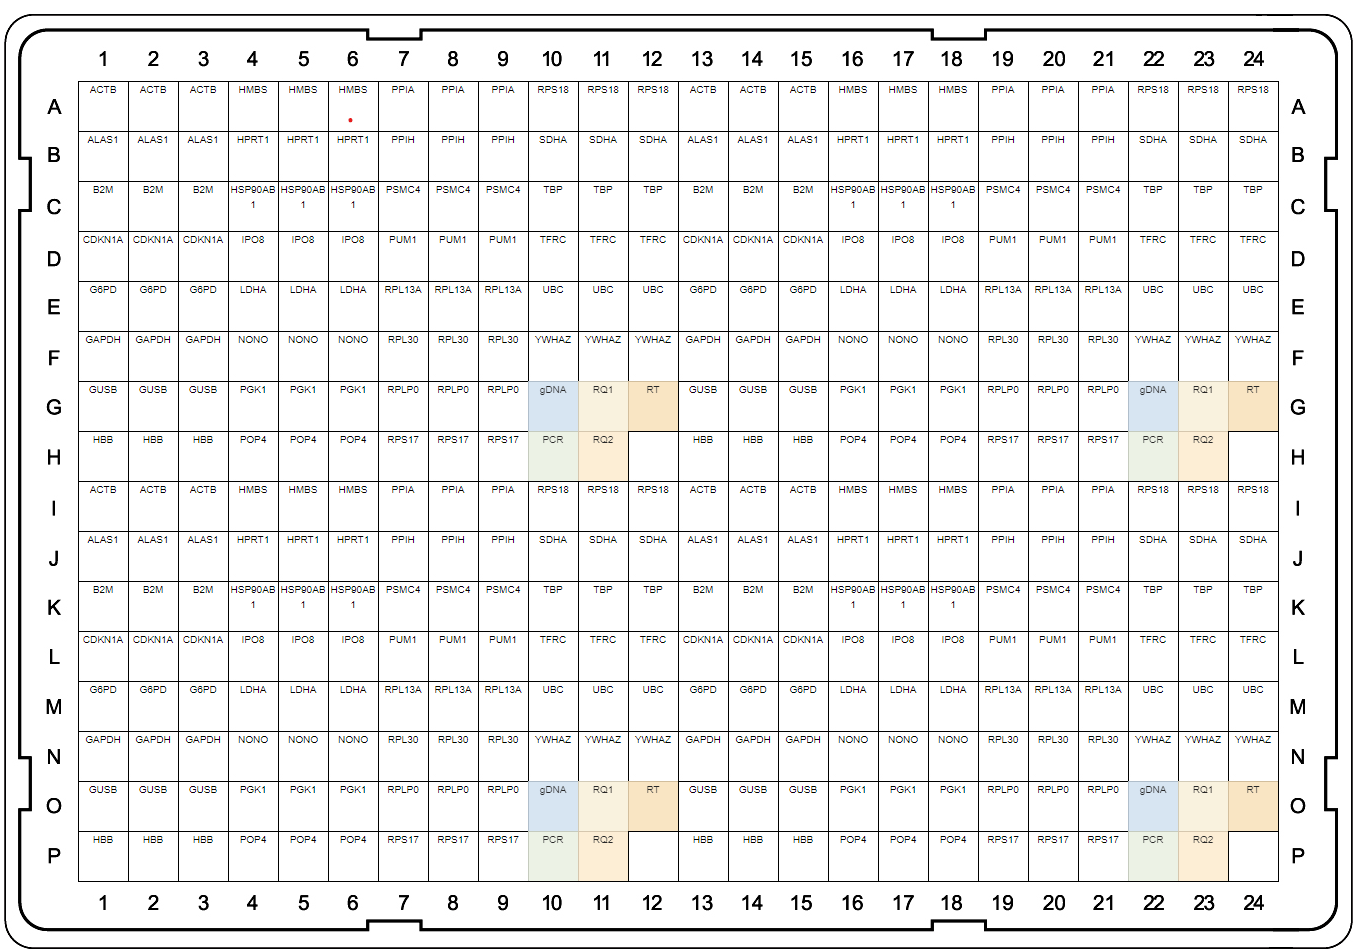
B
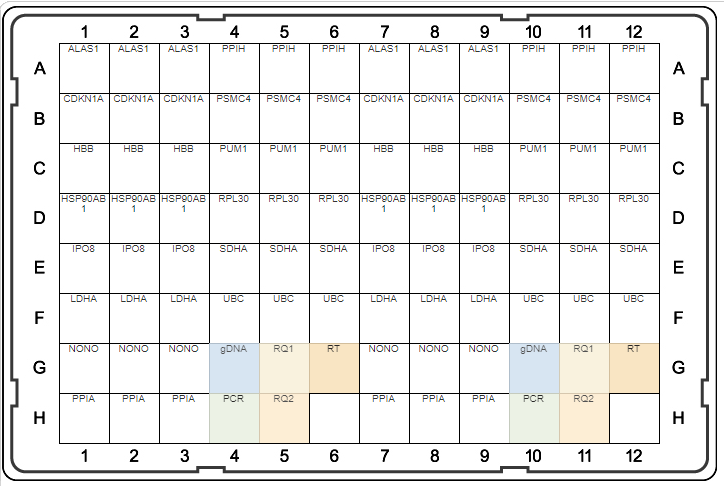
Fig. 1. Plate maps of Reference Genes H384 (A) and Reference Genes Plus H96 (B). PrimePCR Plates were developed to be run with SsoAdvanced Universal SYBR® Green Supermix and include control wells to detect genomic DNA contamination (gDNA), RNA quality (RQ1 and RQ2), and qualitative reverse transcription (RT) and PCR controls.
Several algorithms have been developed to validate reference gene selection (De Spiegelaere et al. 2015, Petriccione et al. 2015). CFX Maestro Software utilizes the GeNorm algorithm, the details of which are described in Vandesompele’s study (Vandesompele et al. 2002). Briefly, the ratio of a pair of reference genes and all pairwise variations is calculated across all samples. The M value is the arithmetic mean of all pairwise variations. The lower the M value, the more stable the reference gene, where stability is defined as (Ln(1/Avg M)).
The Reference Gene Selection Tool is enabled by creating a gene study with one or more CFX Maestro data files and will automatically calculate the stability (M values) of each reference gene across all the included samples. The stability is represented graphically, with green, yellow, and red color-coding corresponding with the evaluation result: Ideal, Acceptable, and Unstable. A table provides the results including calculated M value, stability, and number of valid samples.
Results and Discussion
As shown in Figure 2, cDNAs from three prostate cancers were run on the CFX384 Touch Real-Time PCR System using a Reference Gene H384 Plate and analyzed by CFX Maestro Software. The software calculates an M value for each reference gene, which is included in a table, and displays a graph showing the relative stabilities of all genes tested.
Based on this analysis, the most suitable reference genes can be easily selected for these prostate cancer samples. This pilot study also demonstrated that classical and sometimes even previously reported reference genes will not always be appropriate choices. For instance, ACTB and SDHA were considered as optimal reference genes for prostate cancer samples (Zhao et al. 2018); however, across the samples used in this study, ACTB was found to be “Acceptable” and SDHA was found to be “Unstable.”
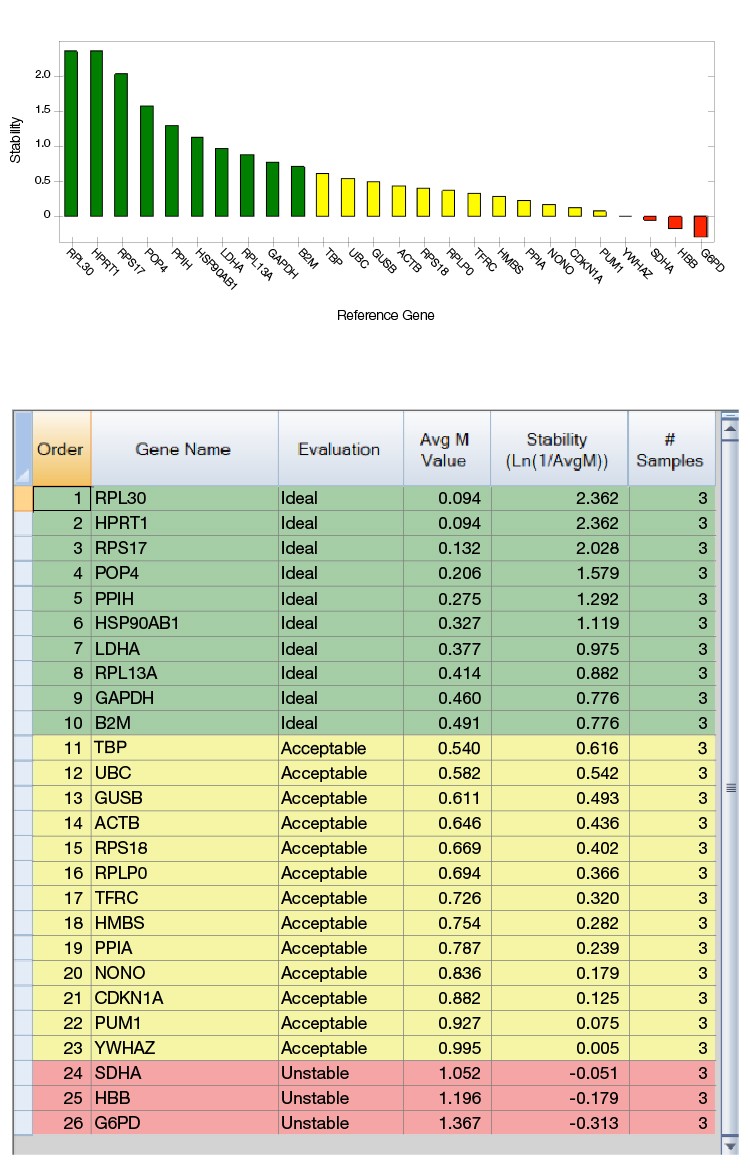
Fig. 2. PrimePCR Reference Gene Selection Plate run with prostate cancer cDNAs from three patients. A, reference gene stability plot showing the suitability of reference genes from the most stable to the least stable ones. Green represents “Ideal”, yellow represents “Acceptable”, and red represents “Unstable.” B, reference gene stability table showing the detailed analysis of all reference genes included in the calculation.
We performed a reference gene study for an experiment in which we obtained Pan-T cells (CD3+) from four donors. We reserved an unstimulated control from each donor, stimulated the T cells, then either treated them with nivolumab or left them untreated, and sampled at four time points. There were a total of nine samples from each donor. The four donors were analyzed together as four biological groups, with nine samples in each group. Based on this analysis, the most stable reference genes that suit all the donors and all the conditions can be selected (Figure 3).
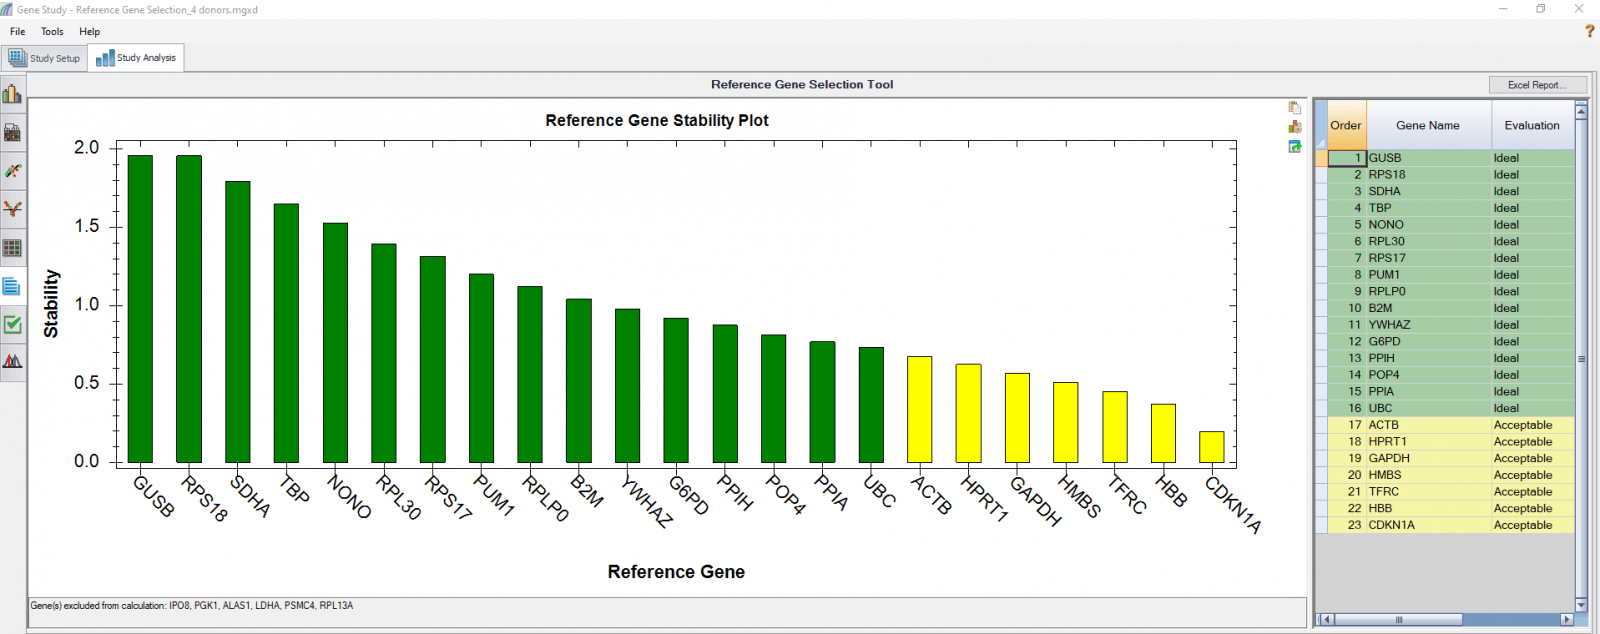
Fig. 3. PrimePCR reference gene selection study based on four donor–T cell samples. Each donor’s samples were treated under nine different conditions and the four donors were analyzed together as four biological groups. A, reference gene stability plot showing the suitability of reference genes across all donor samples treated under nine different conditions. Green represents “Ideal” and yellow represents “Acceptable”. Genes that were not detected in every sample were automatically excluded by the software and listed at the bottom of the chart (gene(s) excluded from calculation: IPO8, PGK1, ALAS1, LDHA, PSMC4, RPL13A). B, reference gene stability table showing the detailed analysis and summary of all reference genes included.
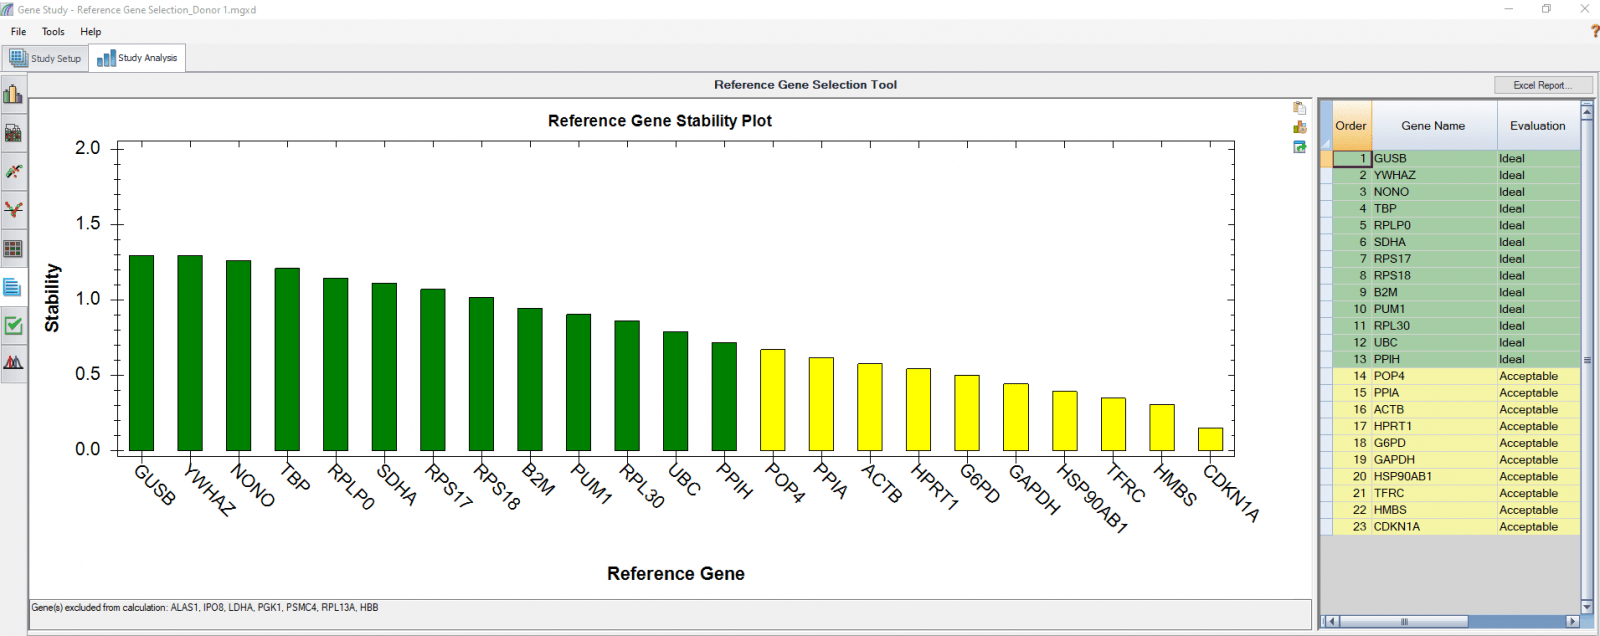
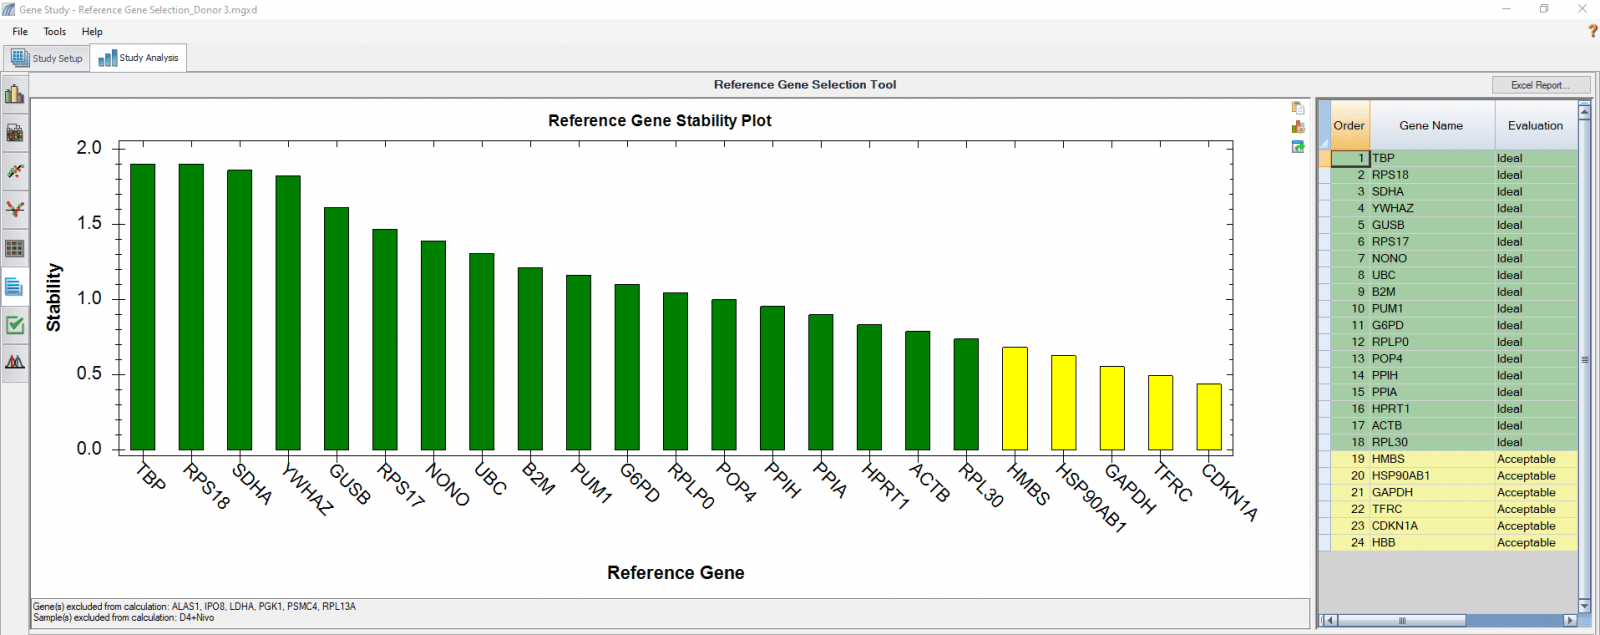
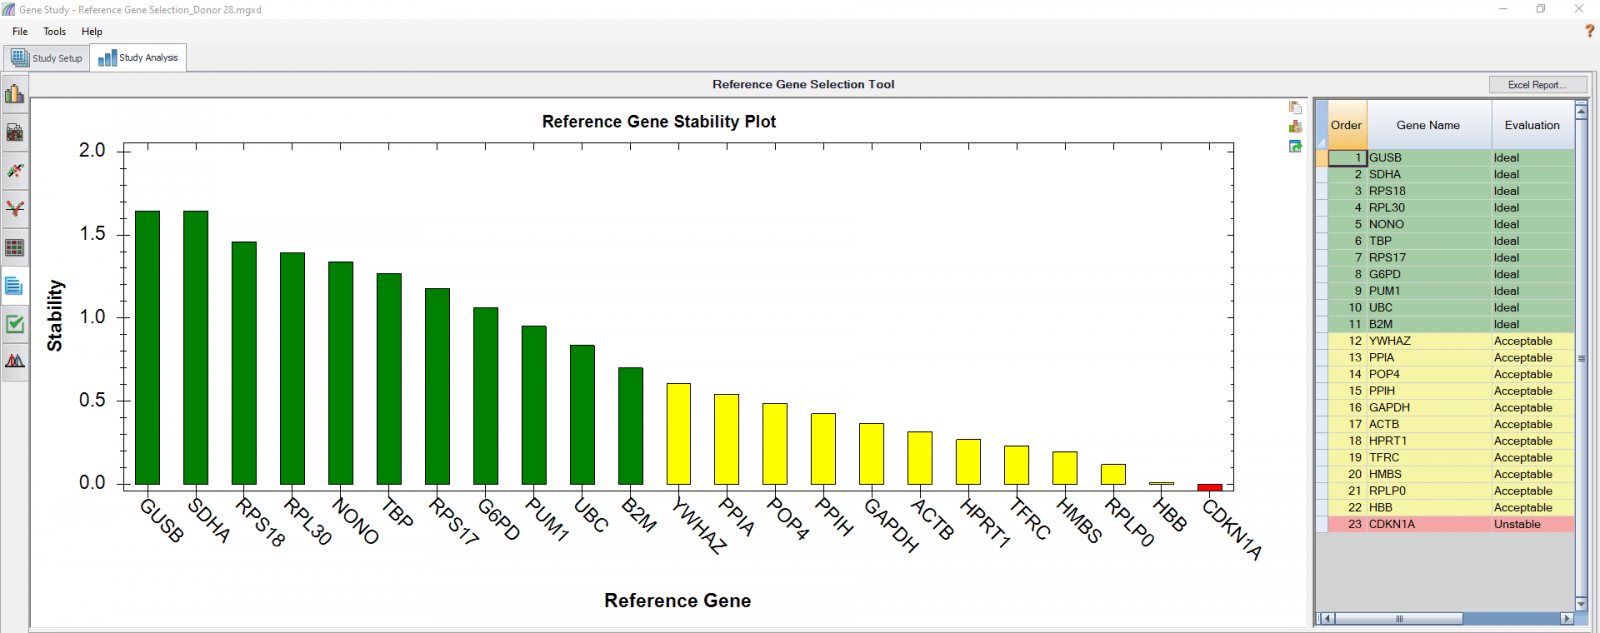
We also analyzed results of each donor separately (Figure 4) in order to compare donor-donor variability. The separate analysis provides more donor-specific information, which can be very helpful when choosing the best reference genes. For instance, TBP and NONO were evaluated to be “Ideal” when the calculation was carried out using four donors as four biological groups. However, they are only calculated to be “Acceptable” for donor 48 when the calculation was done separately. As another comparative example, GUSB, RPS18, and SDHA were calculated to be “Ideal” in all donors in both group and individual calculations and therefore can be chosen as the most suitable reference genes in downstream gene expression studies.
A
B
C
D
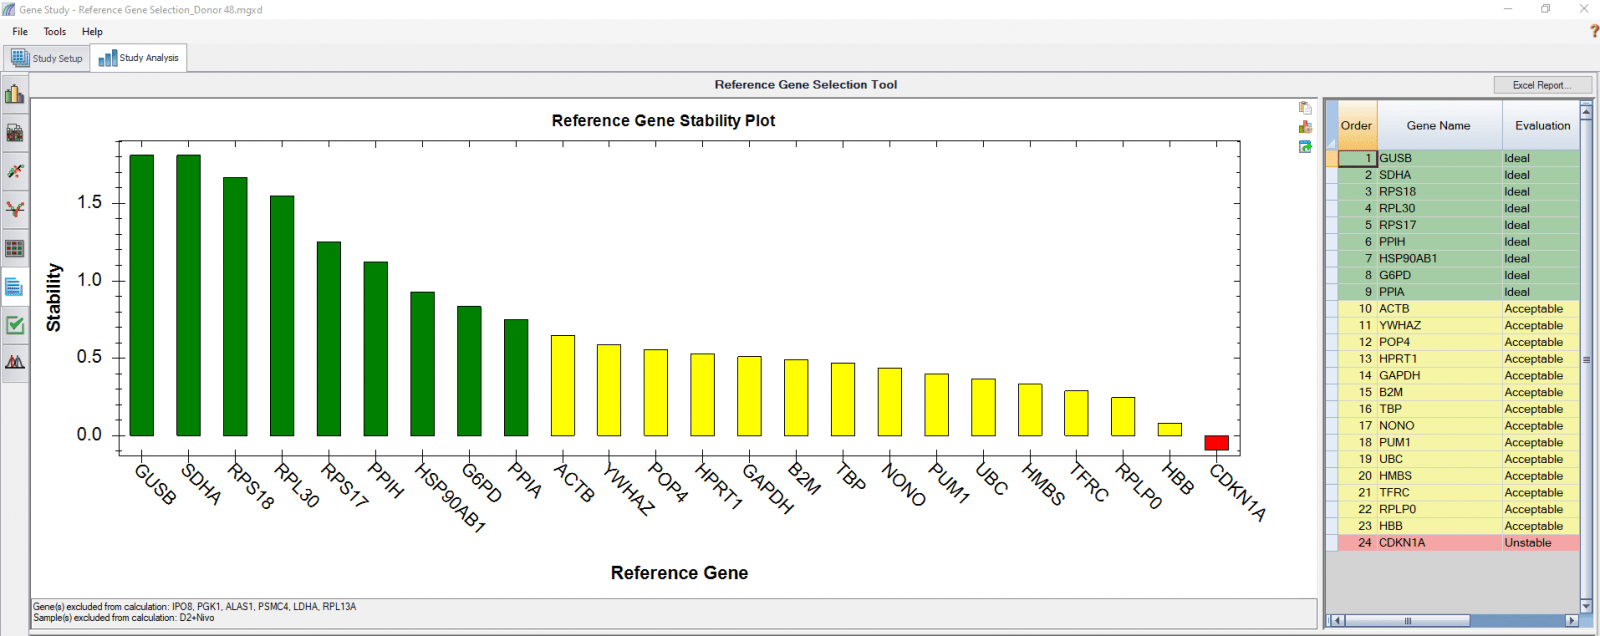
Fig. 4. Reference gene selection based on four donor–T cell samples. Each donor’s samples were treated under nine different conditions and the four donors (A-D) were analyzed separately to compare donor-donor variability. Reference gene stability plots showed the suitability of reference genes across samples treated with nine different conditions. Green represents “Ideal”, yellow represents “Acceptable”, and red represents “Unstable”. The reference gene stability tables show the detailed analysis and summary of all reference genes tested.
When a reference gene is expressed at very low or undetectable quantities (Cq > 35), the software will automatically exclude it from the stability calculation, as shown in Figures 3 and 4. Additionally, if only one sample shows a late Cq (>35) for a particular reference gene, the sample may be excluded in order to retain the reference gene information (Figures 4B and 4D). It is possible to go to the Experimental Settings icon and manually deselect specific reference genes and or samples. For instance, the excluded samples in Figures 4B and 4D can be included in the analysis by simply removing the reference gene HBB.
In order to evaluate sample quality, all Bio-Rad PrimePCR Plates contain built-in controls, which are automatically recognized by CFX Maestro Software. A detailed report is generated for convenient quality check of samples and qPCR reactions, as shown in Figure 5. The PCR control determines if samples contain inhibitors or other factors that may negatively affect gene expression results. The RT control is used to assess the presence of a synthetic RNA template in the cDNA synthesis reaction to evaluate the RT performance within the sample. The gDNA control tests the presence of genomic DNA contamination in the cDNA sample. The RQ controls (RQ1 and RQ2) test the integrity of RNA and indicate whether RNA degradation may negatively impact gene expression results.
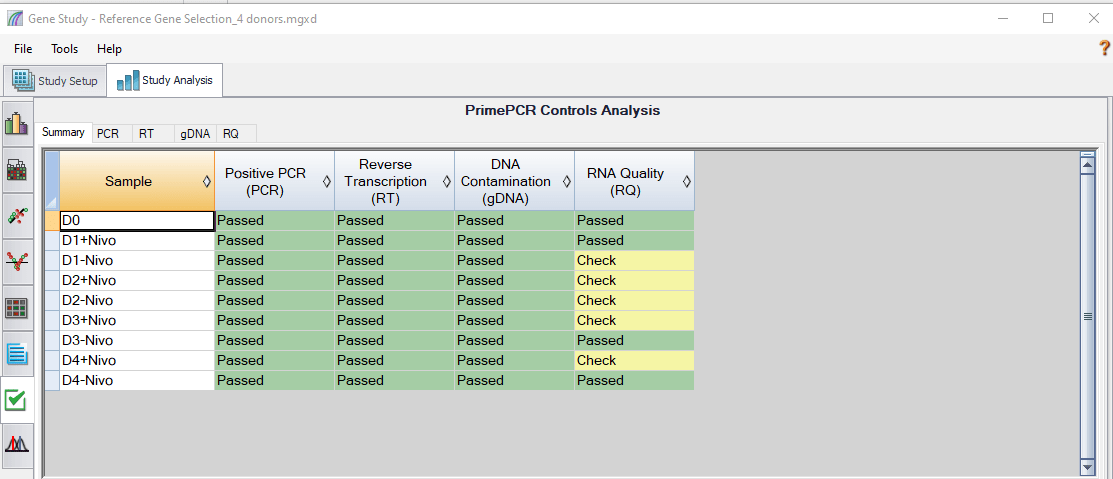
Fig. 5. PrimePCR controls analysis showing the summary of all tested samples analyzed by CFX Maestro Software. Samples that pass all of the control assays appear in green (Passed). These samples are likely to provide quality data in downstream analysis. Samples that fail one or more of the control assays appear in yellow (Check). These samples should be investigated further. Furthermore, different tabs can be selected for a particular control assay (PCR, RT, gDNA, or RQ) to check additional data about that assay.
Reference gene selection and validation are very important for gene expression studies that involve different samples or experimental conditions and therefore are absolutely necessary before any further exploration. Relying on classical reference genes can lead to faulty interpretation of gene expression results in all downstream applications and jeopardize the entire study. PrimePCR Reference Gene Selection Panels provide an easy-to-use system with which to select appropriate reference genes.
References
De Spiegelaere W et al. (2015). Reference gene validation for RT-qPCR, a note on different available software packages. PLoS ONE 10, e0122515.
Jain N et al. (2018). Validation of house-keeping genes for normalization of gene expression data during diurnal/circadian studies in rice by RT-qPCR. Sci Rep 8, 3203.
Lacerda LM et al. (2014). Reference gene selection for qPCR analysis in tomato-bipartite begomovirus interaction and validation in additional tomato-virus pathosystems. PLoS ONE 10, e0136820.
Petriccione M et al. (2015). Reference gene selection for normalization of RT-qPCR gene expression data from Actinidia deliciosa leaves infected with Pseudomonas syringae pv. actinidiae. Sci Rep 5, 16961.
Radonic A et al. (2004). Guideline to reference gene selection for quantitative real-time PCR. Biochem Biophys Res Commun 313, 856–862.
Vandesompele J et al. (2002). Accurate normalization of real-time quantitative RT-PCR data by geometric averaging of multiple internal control genes. Genome Biol 3, research0034.
Zhao H et al. (2018). Identification of valid reference genes for mRNA and microRNA normalisation in prostate cancer cell lines. Sci Rep 8, 1949.