Abstract
For a comprehensive approach to gene expression studies that evaluates both transcriptional and translational regulation, we developed a streamlined protocol for parallel RNA and protein analysis using a single lysate produced from cultured cells. This was achieved using the SingleShot Cell Lysis RT-qPCR Kits, which eliminate the need for RNA purification and are compatible with both reverse transcription quantitative PCR (RT-qPCR) and western blot analysis. This method was further improved using stain-free gel technology, which allows for total protein normalization during western blot analysis and eliminates the need for prior protein quantification. The use of a single lysate also serves to reduce the burden of cell culture by reducing the number of cells required for analysis.
Figures

Figure 1. SingleShot workflow for RNA and protein detection

Figure 2. Effect of retinoic acid treatment on mRNA and protein levels

Figure 3. Effect of retinoic acid treatment on GAPDH mRNA and protein levels
Introduction
As the interrogation of biological systems reveals complex patterns of regulation between RNA and protein expession, co-analysis of these distinct cellular components becomes necessary. For example, although correlated expression of a specific mRNA and protein is expected, posttranslational regulation can lead to a decoupling of the relationship (Kaelin WG 2005). Traditional sample preparation methods purify either RNA or protein from a biological sample. This poses an issue for small samples that cannot be easily split and heterogeneous samples that may display differing levels of expression upon division.
Here, we introduce a streamlined protocol for parallel gene expression analysis using RT-qPCR and western blot analysis from a single, small cell culture sample using Bio-Rad’s SingleShot Cell Lysis Kit (Figure 1). We show that cells cultured in one well of a 96-well plate can be sufficient for analysis of both RNA and protein. This offers the flexibility to accommodate additional treatment groups or biological replicates within an experiment or a means to reduce cell culture costs.
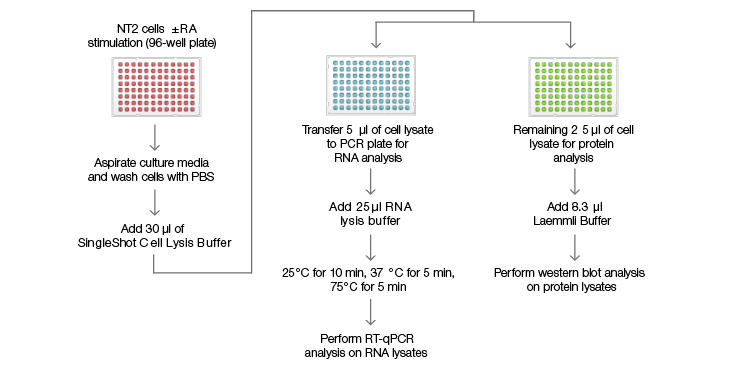
Fig. 1. SingleShot workflow for RNA and protein detection. NTera 2 (NT2) cells were cultured in a 96-well plate for 4 days with or without retinoic acid (RA) treatment before being lysed in 30 µl of SingleShot Buffer. The cell lysate from each well was divided into two parts: (1) 5 µl of the lysate were mixed with SingleShot Buffer containing proteinase K (PK) and DNase to degrade genomic DNA. The sample was used to measure the mRNA levels of the genes of interest using RT-qPCR; (2) 25 µl of the cell lysate were mixed with 8.3 µl of 4x Laemmli Buffer before loading onto a stain-free gel for western blot analysis.
To assess the performance of this workflow, we investigated the expression of pluripotency factors in a human stem cell model system. NTera2 (NT2) cells are a human embryonal carcinoma cell line that, when treated with retinoic acid (RA), differentiate into neurons (Andrews 1984, Pleasure and Lee 1993, Pleasure et al. 1992). As NT2 cells differentiate, the level of pluripotency factors decreases and the level of neuronal factors increases (Deb-Rinker et al. 2005, Przyborski et al. 2003). We analyzed three transcription factors, NANOG and OCT4A, which mediate pluripotency and are downregulated during stem cell differentiation (Przyborski et al. 2003), and HOXB3, which controls cell differentiation via downstream target gene regulation (Viganὸ et al. 1998). We sought to determine if the levels of the OCT4A, NANOG, and HOXB3 mRNA and protein correlate, as their expression is regulated during the differentiation process.
Method and Results
Cell Culture
Approximately 5 x 10³ NT2 cells were seeded per well of a 96-well plate in DMEM (ATCC, catalog #30-2002), 10% fetal bovine serum (FBS; ATCC, catalog #30-2020), and 1% penicillin-streptomycin solution (Corning, catalog #30-002-Cl) and cultured per ATCC recommendations. The cells were treated with 10 µM RA (Sigma-Aldrich, catalog #R2625-50MG) to induce differentiation. Control NT2 cells were maintained in culture media without RA. The cells (approximately 2.5 x 10⁴ cells per well) were harvested after four days.
Isolation of RNA and Protein
The NT2 cells were washed with PBS and lysed with 30 µl of SingleShot Cell Lysis Buffer (Bio-Rad Laboratories, catalog #1725095). For RNA analysis, 5 µl of each cell lysate were mixed with 20 µl of RNA lysis buffer (19 µl SingleShot Cell Lysis Buffer, 0.5 µl proteinase K, 0.5 µl DNase). The lysates were incubated at 25°C for 10 min, 37°C for 5 min, and 75°C for 5 min before proceeding with RT-qPCR. For protein analysis, 8.3 µl of 4x Laemmli Buffer, containing 10% v/v β-mercaptoethanol, were added to the remaining 25 µl of cell lysate in each well of the 96-well plate and mixed thoroughly. The lysates were collected before proceeding with electrophoresis.
Note: For buffer and lysate volumes for larger culture plates, refer to bulletin 6776.
Analysis of mRNA Levels
The iTaq™ Universal SYBR® Green One-Step Kit components, provided in the SingleShot™ SYBR® Green One-Step Kit (Bio-Rad, catalog #1725095), were used to prepare 20 µl reactions for one-step RT-qPCR. Two microliters of RNA lysate and the appropriate PrimePCR™ Assays diluted to a 1x concentration were added to the reactions in the 96-well plate. The plate was loaded into a CFX96 Touch™ Real-Time PCR Detection System (Bio-Rad, catalog #1855195) and run using the following protocol: 50°C for 10 min, 98°C for 2 min, 40 cycles of 98°C for 5 sec and 60°C for 30 sec, melt curve analysis from 60–95°C with 0.5°C increments, and a final hold for 5 sec.
Electrophoresis
Criterion™ Cell (Bio-Rad, catalog #1656001) was loaded with 1x TGS buffer. The samples were loaded onto an Any kD™ Criterion™ TGX Stain-Free™ Protein Gel (Bio-Rad, catalog #5678123) and run for 20 min at 300 V. The gel was removed from the plastic cassette and placed on a stain-free/UV imaging tray. The stain-free chemistry in the gel was UV-activated for 45 sec.
Western Blotting
The gel and activated LF-PVDF membrane were assembled into the blotting sandwich according to the manufacturer’s instructions. The transfer cassette was inserted into the TransBlot® Turbo™ Transfer System (Bio-Rad, catalog #1704155) and the proteins transferred from the gel to the membrane (mixed MW mode: 2.5 A, 25 V max voltage, 7 min). The blotting sandwich was disassembled and the blot was placed on the stain-free/UV tray and imaged on the ChemiDoc™ Touch Imaging System (Bio-Rad, catalog #1708370) using the Stain Free Blot image settings.
Immunodetection
The blot was placed in 50 ml of blocking buffer (Bio-Rad, catalog #1610782) and incubated while rocking for 6 hr at 4°C. After discarding the blocking buffer, the blot was placed in 50 ml of blocking buffer containing primary antibody and incubated while rocking for 12 hr at 4°C. The following rabbit primary antibodies were used: NANOG (1:1,000; Cell Signaling Technology, catalog #3580S), OCT4A (1:1,000; Cell Signaling Technology, catalog #2890S), HOXB3 (1:5,000; Abcam, catalog #ab83404), and GAPDH (1:10,000; Bio-Rad Antibodies, catalog #AHP1628). After discarding the primary antibody solution, the blot was washed with 50 ml of TBS-T for 5 min at room temperature while rocking a total of five times. The blot was then placed in 50 ml of HRP conjugated anti-rabbit secondary antibody (Bio-Rad, catalog #1662408) and incubated while rocking for 1 hr at room temperature. A 1:5,000 dilution of the secondary antibody was used for the NANOG and OCT4A blots while a 1:10,000 dilution was used for the HOXB3 and GAPDH blots. After discarding the secondary antibody solution, the blot was washed with 50 ml of TBS-T for 5 min at room temperature while rocking a total of six times. Finally, the blot was incubated in 10 ml of Clarity™ Western ECL Substrate (Bio-Rad, catalog #1705061).
Data Analysis
The stain-free and chemiluminescence images were used to create a multichannel image in Image Lab™ Software, version 5.2.1. Total protein normalization was performed using the stain-free blot image as the total protein signal and the chemiluminescence image as the target protein signal. The reported average and standard deviation values were based on technical duplicates.
Results
Changes in RNA and Protein Expression of Various Transcription Factors during NT2 Cell Differentiation
RA induces NT2 cell differentiation. After four days of RA treatment, we observed that the mRNA and protein levels of OCT4A decreased by 89% and 78%, respectively, compared to the undifferentiated control cells (Figure 2). Similarly, for the transcription factor NANOG, mRNA and protein levels decreased by 92% and 93%, respectively, compared with the control cells (Figure 2). Interestingly, we observed that while the mRNA levels of HOXB3 increased by approximately 17-fold, the protein levels actually decreased by 49% compared with the undifferentiated control cells (Figure 2). Our data indicate corresponding decreases in both the mRNA and expressed protein levels for both OCT4A and NANOG. However, we did not observe an increase in protein levels corresponding to the increased mRNA levels for HOXB3. While at this time we cannot draw any defintive conclusions regarding the regulation of HOXB3 transcription and translation, the results are nevertheless interesting and demonstrate the value in monitoring both mRNA and protein levels.
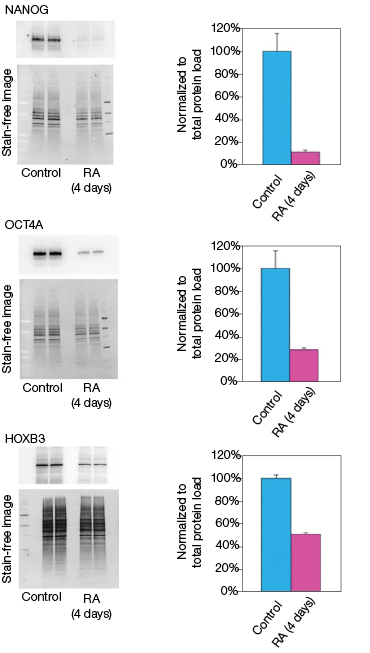
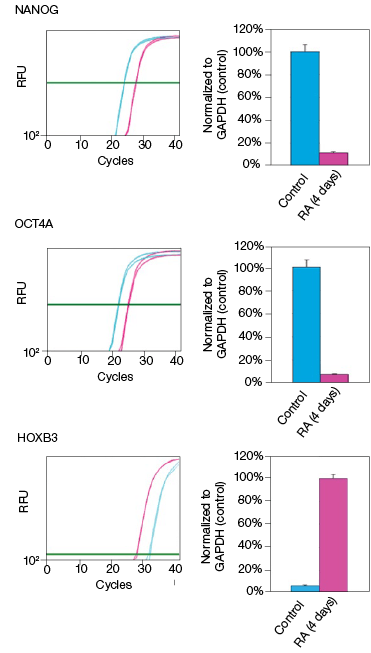
Fig. 2. Effect on the mRNA and protein levels of NANOG, OCT4A, and HOXB3 in NT2 cells after RA treatment. A, lysates from two control and two RA-treated samples were separated on Any kD Criterion TGX Stain-Free Gels and immunoprobed for NANOG, OCT4A, and HOXB3. In the chemiluminescence blot images, the levels of NANOG, OCT4A, and HOXB3 protein in the RA-treated cells are decreased. However, as shown on the stain-free blot images, the amount of total protein in the RA-treated cultures was less than in the control cultures. Normalization of the NANOG, OCT4A, and HOXB3 levels against total protein levels in the RA-treated cells revealed a 50–90% decrease compared to the controls. B, NANOG, OCT4A, and HOXB3 mRNA expression levels were determined in the control and RA-treated samples. The expression levels of NANOG and OCT4A decreased by at least 90% in the RA-treated cells while those of HOXB3 increased by approximately 17- fold. The experiment was repeated three times and representative data are presented. RFU, relative fluorescence units.
Discussion
Stain-Free Gel Technology and Total Protein Normalization Eliminate the Need for Protein Assays in the SingleShot Workflow
Protein assays are a means of determining sample concentration and are often utilized in western blotting to provide a way to load equal amounts of sample for comparison. In addition to the protein assay, most scientists measure the level of a housekeeping protein at the immunodetection step to confirm equal loading of the sample. Recently, total protein normalization has been adopted as a reliable alternative to using a housekeeping protein to confirm equivalent sample loading (Aldridge et al. 2008, Gilda and Gomes 2013, Vigelsø et al. 2015). Stain-free gel technology offers a method to visualize and measure the amount of total protein on the blot and provides an effective way to normalize the samples (Posch et al. 2013).
To determine whether stain-free gel technology can replace protein assays, we examined the change in GAPDH expression during NT2 cell differentiation. The GAPDH mRNA level remained constant in the control and RA-treated cultures, as indicated by the real-time PCR data (Figure 3). The protein extracts from two control and two RA-treated samples were loaded onto a stain-free gel for western blot analysis. From the chemiluminescence blot image, it appears that the GAPDH level decreased by approximately 30% in the RA-treated cells. However, the stain-free blot image shows that there was less RA-treated lysate loaded. After normalizing against the total protein load, the GAPDH protein levels were consistent among the control and the RA-treated samples. This result demonstrates that stain-free total protein normalization offers a reliable method to control for loading differences between samples, eliminating the need for a protein quantification assay. Of note, we compared protein yields between samples prepared via traditional RIPA-based lysis methods and SingleShot-based lysis methods and observed equivalent yields (data not shown).
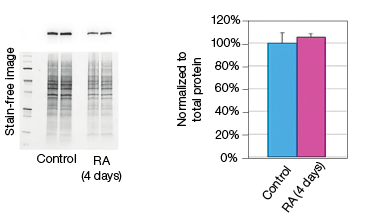
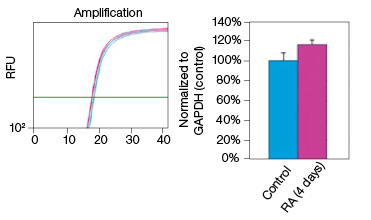
Fig. 3. Constant expression of GAPDH RNA and protein levels in the NT2 cells after RA stimulation. A, lysates from two control and two RA-treated samples were separated on an Any kD Criterion TGX Stain-Free Gel and immunoprobed for GAPDH. In the chemiluminescence blot image, the level of GAPDH in the RA-treated cells appear decreased. However, the stain-free blot image clearly shows that the amount of total protein in the RA-treated cultures was much less than in the control cultures. Normalization of GAPDH levels against the amount of total protein revealed a similar level of GAPDH protein in the control and RA-treated cells. B, GAPDH mRNA expression levels were determined in the control and RA-treated samples. GAPDH gene expression level was comparable in the control and RA-treated cells after four days of treatment. The experiment was repeated three times and representative data are presented. RFU, relative fluorescence units.
When Less Is More
It is common for scientists to grow cells in large petri dishes for in vitro RNA or protein assays such as RT-qPCR and western blotting. However, in our experiment, we demonstrate that a single well of a 96-well-plate can offer sufficient cell content for both RT-qPCR and western blot analysis. Normally, the amount of RNA or protein from a 96-well plate may not be sufficient for both RNA purification and a protein assay using standard extraction buffers. Fortunately, the SingleShot Buffer eliminates the need for RNA purification since it removes genomic DNA and the RT-qPCR reaction is tolerant of the RNA lysate. Furthermore, stain-free gel technology eliminates the need for a protein assay.
By reducing the size of the culture vessel to a 96-well-plate, the researcher can reduce the amount of cell culture reagents consumed and may shorten growth time as well. In our experiment, we needed to seed only 5,000 cells in each well and maintained the cultures using 200 µl of medium, while lysis was performed using only 30 µl of the SingleShot Buffer. This experimental setup would be very useful for labs using primary cells in research where the number of available cells is limited. By reducing the size of the cell culture, a researcher could also accommodate higher levels of replication, potentially producing more statistically significant and meaningful results. Additionally, the results reported here underscore the importance of monitoring both mRNA and protein expression levels without assuming a general correlation between the two. While we observed a correlative downregulation for two targets upon differentiation, we observed an inverse correlation for a third target, highlighting the complexity of the regulatory events taking place.
Conclusion
In summary, the protocol presented here for parallel gene expression analysis from small cell culture samples using RT-qPCR and western blot analysis is valuable because it offers an integrated view of gene expression and protein levels to validate potential biomarkers. We demonstrated its benefits by monitoring three transcription factors in NT2 cell differentiation. The same analysis could be applied to validate other biomarker candidates or transcription factors. Integrated gene/protein biomarkers and interaction networks have gained attention in the research community and have been used to monitor drug response in cancer research (Warsow et al. 2013). This workflow utilizing SingleShot Cell Lysis Kits provides a useful tool for facilitating such research.
References
Aldridge GM et al. (2008). The use of total protein stains as loading controls: an alternative to high-abundance single-protein controls in semi-quantitative immunoblotting. J Neurosci Methods 172, 250–254.
Andrews PW (1984). Retinoic acid induces neuronal differentiation of a cloned human embryonal carcinoma cell line in vitro. Dev Biol 103, 285–293.
Deb-Rinker P et al. (2005). Sequential DNA methylation of the Nanog and Oct-4 upstream regions in human NT2 cells during neuronal differentiation. J Biol Chem 280, 6257–6260.
Gilda JE and Gomes AV (2013). Stain-free total protein staining is a superior loading control to β-actin for western blots. Anal Biochem 440, 186–188.
Kaelin WG (2005). Proline hydroxylation and gene expression. Annu Rev Biochem 74, 115–128.
Pleasure SJ and Lee VM (1993). NTera 2 cells: a human cell line which displays characteristics expected of a human committed neuronal progenitor cell. J Neurosci Res 35, 585–602.
Pleasure SJ et al. (1992). Pure, postmitotic, polarized human neurons derived from NTera 2 cells provide a system for expressing exogenous proteins in terminally differentiated neurons. J Neurosci 12, 1802–1815.
Posch A et al. (2013). V3 stain-free workflow for a practical, convenient, and reliable total protein loading control in western blotting. J Vis Exp 30, e50948.
Przyborski SA et al. (2003). Transcriptional profiling of neuronal differentiation by human embryonal carcinoma stem cells in vitro. Stem Cells 21, 459–471.
Viganò MA et al. (1998). Definition of the transcriptional activation domains of three human HOX proteins depends on the DNA-binding context. Mol Cell Biol 18, 6201–6212.
Vigelsø A et al. (2015). GAPDH and β-actin protein decreases with aging, making stain-free technology a superior loading control in western blotting of human skeletal muscle. J Appl Physiol (1985) 118, 386–394.
Warsow G et al. (2013). Differential network analysis applied to preoperative breast cancer chemotherapy response. PLoS One 8, e81784.
Visit the SingleShot Product Page for specifications and ordering information.
SYBR is a trademark of Life Technologies Corporation. Bio-Rad Laboratories, Inc. is licensed by Life Technologies Corporation to sell reagents containing SYBR Green I for use in real-time PCR, for research purposes only.
Bio-Rad’s thermal cyclers and real-time thermal cyclers are covered by one or more of the following U.S. patents or their foreign counterparts owned by Eppendorf AG: U.S. Patent Numbers: 6,767,512 and 7,074,367.