Abstract
Pathway analysis is an efficient approach for studying a large number of related gene targets in a single experiment. Bio-Rad Laboratories and Thomson Reuters, a leading provider of system biology tools, have partnered to provide predesigned pathway panels for gene expression analyses using real-time qPCR. This tech report describes how Bio-Rad’s PrimePCR™ pathway panels were curated and designed using a ranking strategy developed by Thomson Reuters.
Introduction
Pathway analysis has become an important application in life science research and drug development. Investigating how individual targets communicate and respond within complex molecular networks has helped elucidate how biological processes function at a cellular level. Academic institutions use network analysis to advance our fundamental understanding of molecular and cellular biology while pharmaceutical companies now apply pathway analysis to the development of next generation therapeutics. With the advent of genomics and personalized medicine, pathway-based analysis will become an even more valuable tool in aiding our understanding and ability to navigate signaling and disease networks. As the body of literature regarding these networks continues to rapidly increase, scientists addressing challenges such as assay design and therapeutics development can utilize this knowledge to increase their chance of success in research and development.
Bio-Rad Laboratories has partnered with GeneGo, a Thomson Reuters business and leading provider of systems biology tools, to offer a complete pathway solution for real-time PCR-based gene expression analysis. As part of the collaboration, Thomson Reuters provided interactive pathway maps for 260 canonical pathways. Each pathway belongs to one or more general biological categories, such as Cancer. The pathway maps illustrate protein interactions and regulation to provide a comprehensive picture of signaling and disease processes (Figure 1). The curated pathways were also used to design panels of real-time PCR assays specifically tailored to the top-ranked gene targets for differential gene expression analysis. Each gene target within a pathway was assigned a score based on frequency of differential expression and popularity in scientific research, both historically and currently. The resulting scores were used to rank and select which assays were included on the corresponding real-time PCR pathway panel.
Thomson Reuters was selected to devise the pathway gene list and rankings based on their superior knowledge base that is widely used for data mining and pathway analysis applications (for example, biomarker discovery, drug target identification). In a recent independent publication by New York University School of Medicine comparing ten public and commercial pathway information providers, Thomson Reuters’ flagship software, MetaCore, was found to be the only knowledge base enabling statistically significant overlap (84% cases) with experimental data when studying target genes of transcription factors (Shmelkov et al. 2011). The highest quality of protein interaction data in MetaCore is supported by 100% manual curation provided by a team of experts with extensive training. Additional benefits include the directionality of interactions showing the signaling path and the effect of interactions (for example, activation or inhibition), the mechanism of interactions (for example, phosphorylation), and a comprehensive ontology of protein groups and complexes. Taken together, this pathway plate design strategy allows for the most focused and tailored approach to gene expression profiling with the specificity, sensitivity, and reproducibility of real-time PCR.
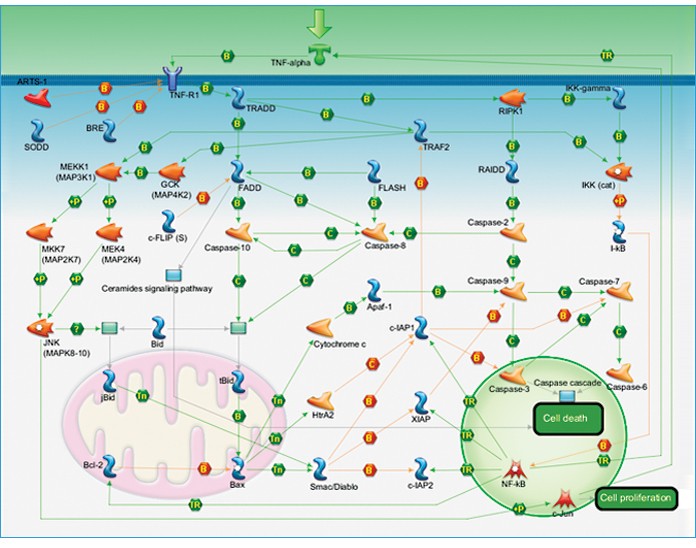
Fig. 1. Apoptosis and survival — TNF-R1 signaling pathway map. This pathway map is one example of the 260 canonical pathway maps provided by Thomson Reuters. Pathway maps illustrate protein interactions and regulation to provide a comprehensive picture of signaling and disease processes. On the Bio-Rad website, each target on the map can be selected to view corresponding gene and protein information.
Target Ranking
Gene assays present on pathway panels have been prioritized based on three main criteria: how often a gene changes expression level in transcriptome studies, how much attention was paid to this gene in the overall scientific research, and how interesting the scientific community found this gene in the last 2 years.
In order to evaluate how often a particular gene changes expression level or is relevant to transcriptome studies (“expression score”), we calculated three parameters covering:
- Number of diseases for which this gene is a biomarker changing expression level (data source: MetaCore)
- Number of samples in which this gene changes expression with a fold change of 1.2 and P value ≤0.05 normalized on sample count (data source: Thomson Reuters OMICs data repository)
- Number of incoming interactions with mechanism “influence on expression” and “transcription regulation” (data source: MetaCore)
In order to estimate how much attention was paid to a gene in the overall scientific research (“all years score”), we calculated seven parameters covering the following:
- Number of diseases for which this gene is a biomarker (data sources: MetaCore and Integrity Biomarkers Module)
- Number of articles that have been published in biomarker research related to this gene (data sources: MetaCore and Integrity Biomarkers Module)
- Number of articles that have been published to study interactions of this gene and protein groups and complexes including this gene (data source: MetaCore). The amount was evaluated separately for human and mouse genes
- Number of pathway maps on which this gene is present (data source: MetaCore)
In order to evaluate how interesting this gene was for the scientific community in the last 2 years (“2010–2011 score”), we calculated nine parameters covering the following:
- Number of articles that have been published in biomarker research related to this gene in 2010–2011: total count and total count normalized on number of articles published in all years (data sources: MetaCore and Integrity Biomarkers Module)
- Number of articles that have been published to study interactions of this gene and protein groups and complexes including this gene in 2010–2011: total count and total count normalized on number of articles published in all years (data source: MetaCore)
- Number of customer visits to corresponding gene pages in MetaCore in 2010–2011
At the next step, the calculated parameters were processed to remove outliers and normalize the values from 0 to 1. Normalized parameters were summed up to calculate three scores for each protein: expression, all years, and 2010–2011 scores. Results for each score were normalized again and included in the final score with equal weights. The final scores for each human and mouse protein were used to prioritize pathway map participants and protein neighbors on interaction networks.
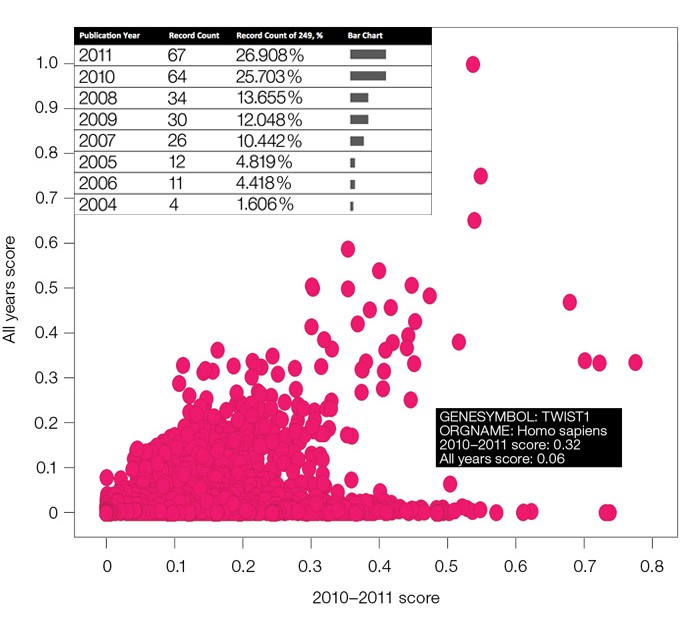
Fig. 2. A distribution of scores of interest for proteins in all years and 2010–2011 years. A higher 2010–2011 score for TWIST1 is confirmed by the increased number of publications related to this protein in the last 2 years.
To validate our algorithm, we ran several tests to explore how well our scores correlate with number of publications registered by article repositories. For example, our calculations found that the TWIST1 protein has a higher 2010–2011 score than all years score revealing that the interest of the scientific community in this protein has grown in the last 2 years (Figure 2). The number of articles published on the protein according to the Web of Knowledge, an article database of Thomson Reuters, confirms this observation.
PrimePCR Pathway and Collection Panel Design
In addition to the 260 pathway maps, Thomson Reuters provided the corresponding list of genes that code for the protein targets present in each pathway and the general biological category. Using the target ranking procedure described above, the top-ranked gene targets from each pathway and category were selected for inclusion on a predesigned real-time PCR plate, referred to as a “panel.” In addition to the 260 pathway-specific panels, collection panels were designed for each of the 57 general biological categories. For example, a pathway panel has been designed for “Apoptosis and Survival — NGF Signaling Pathway” using the top-ranked genes within that canonical pathway. In addition, an “Apoptosis and Survival” collection panel was designed using the highest-ranked gene targets from the cumulative list of genes across the 17 pathways that report to the general “Apoptosis and Survival” category. For both types of panels, PCR plate designs were selected to accommodate the largest number of gene targets while maximizing the number of samples that will fit on a given 96- or 384-well plate format. This panel design strategy allows for a pathway-focused analysis or a more general survey of gene targets across a given biological process (Figure 3).
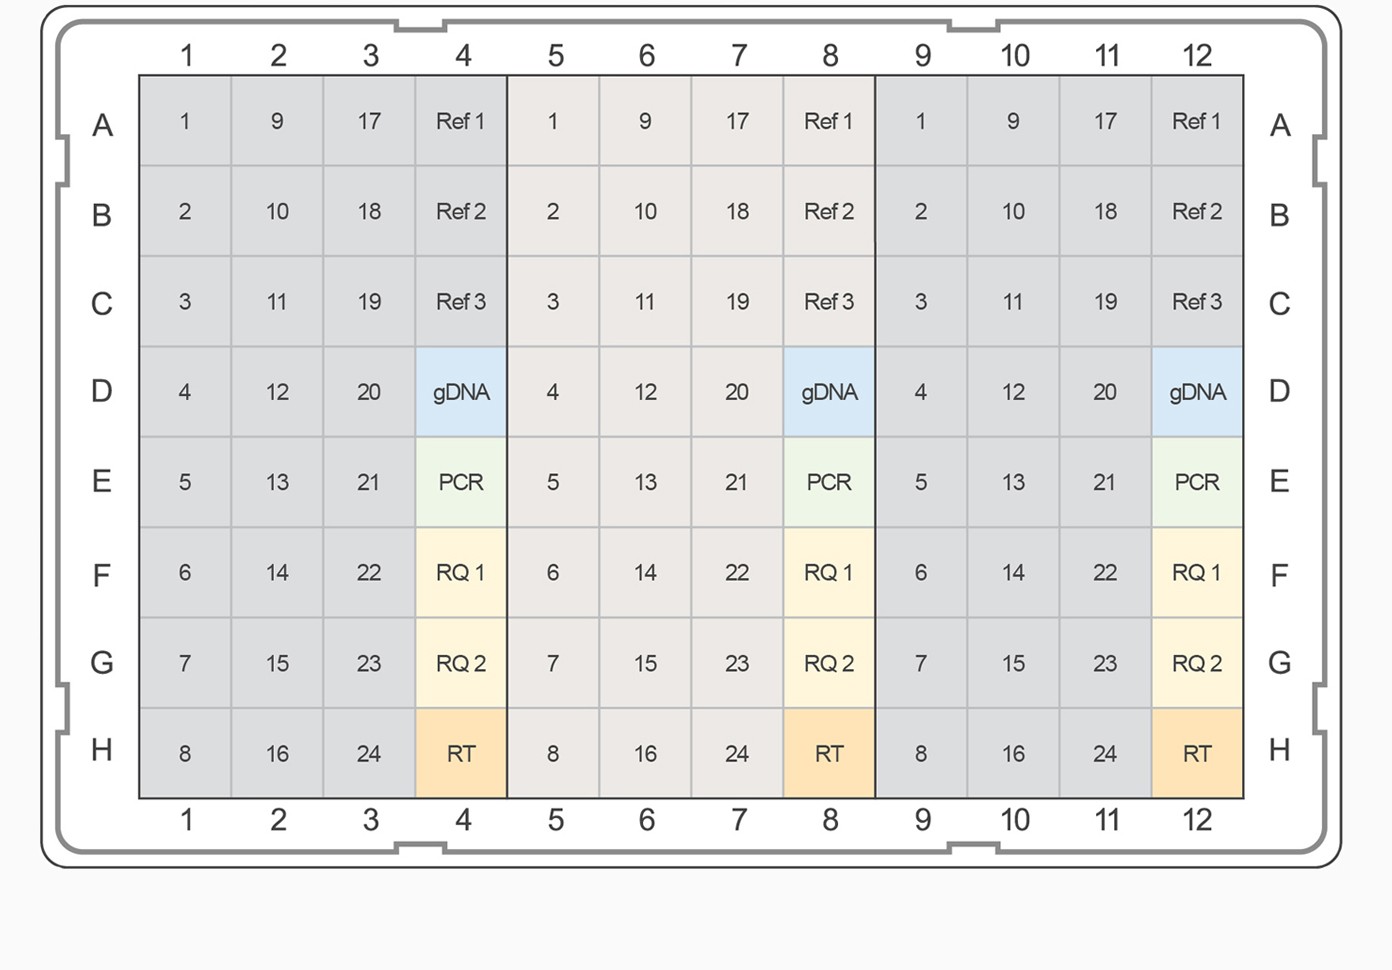 Fig. 3A. 24 genes with 3 reference genes and controls x 3 samples.
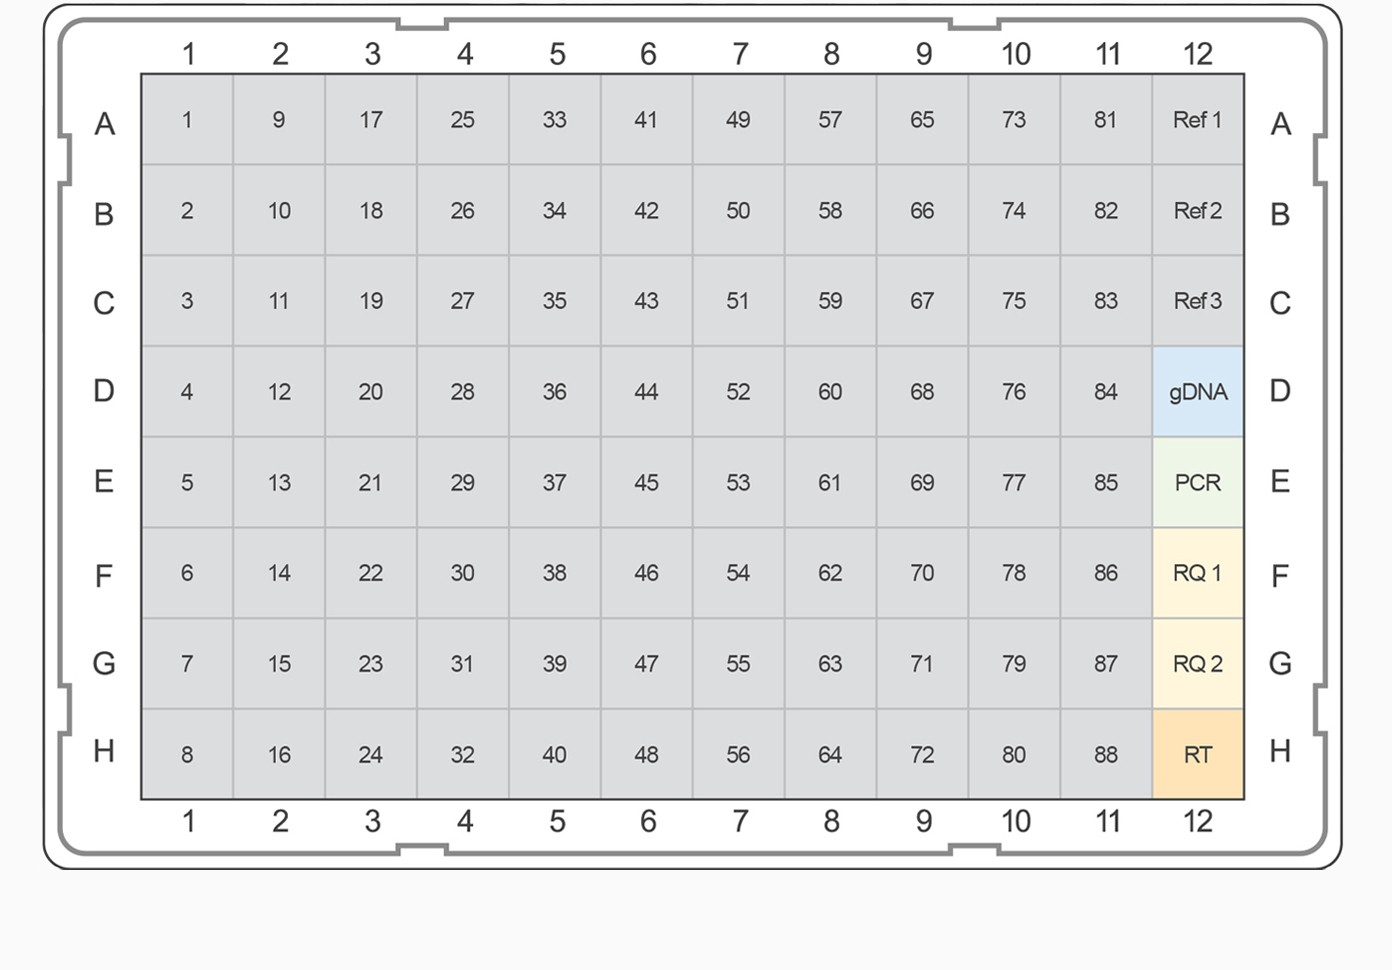
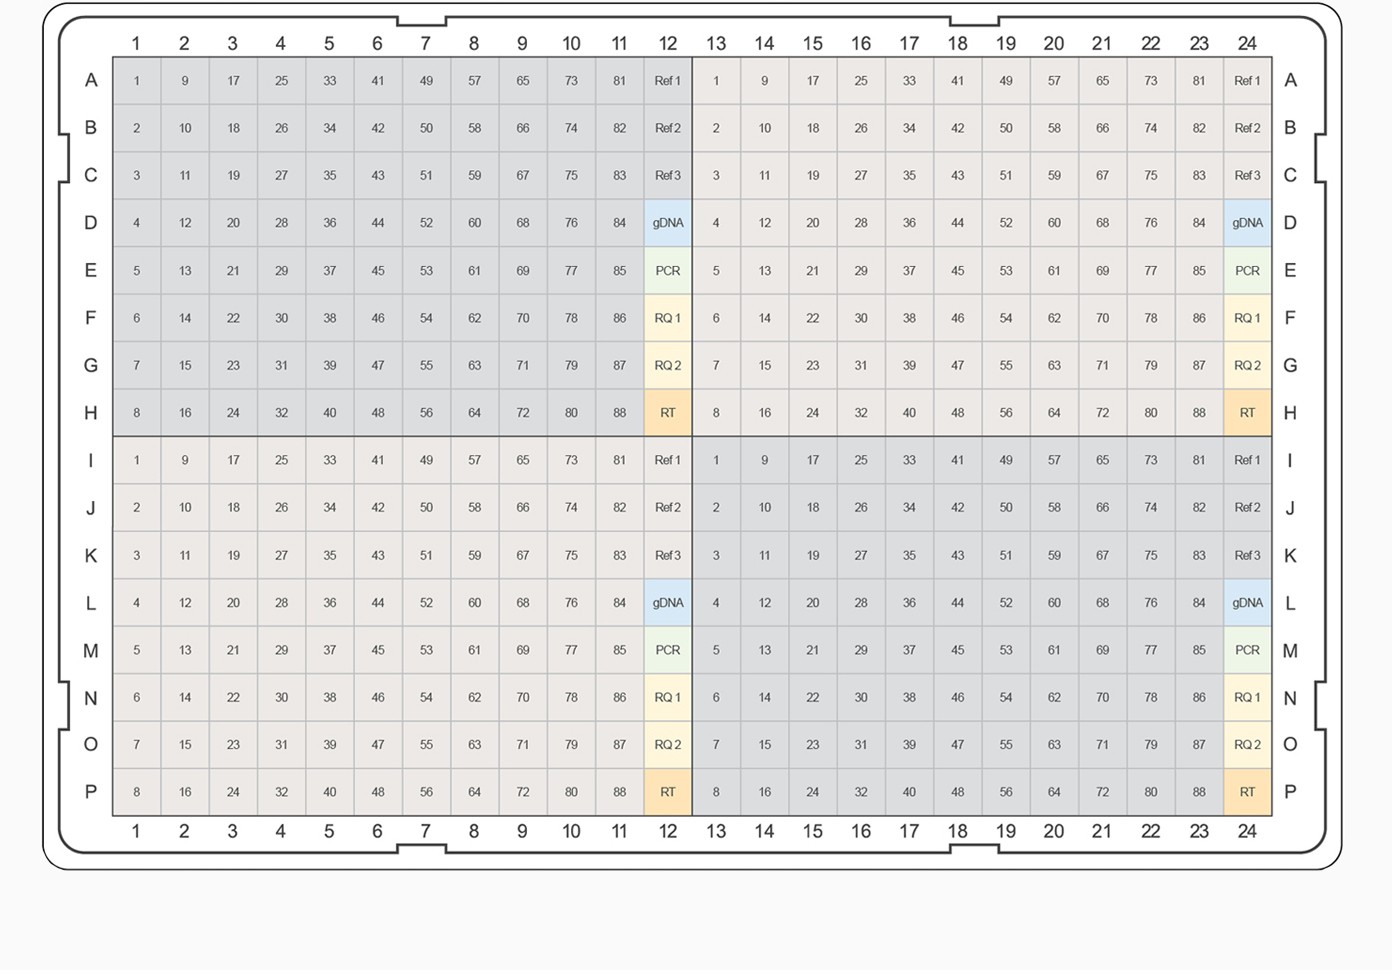
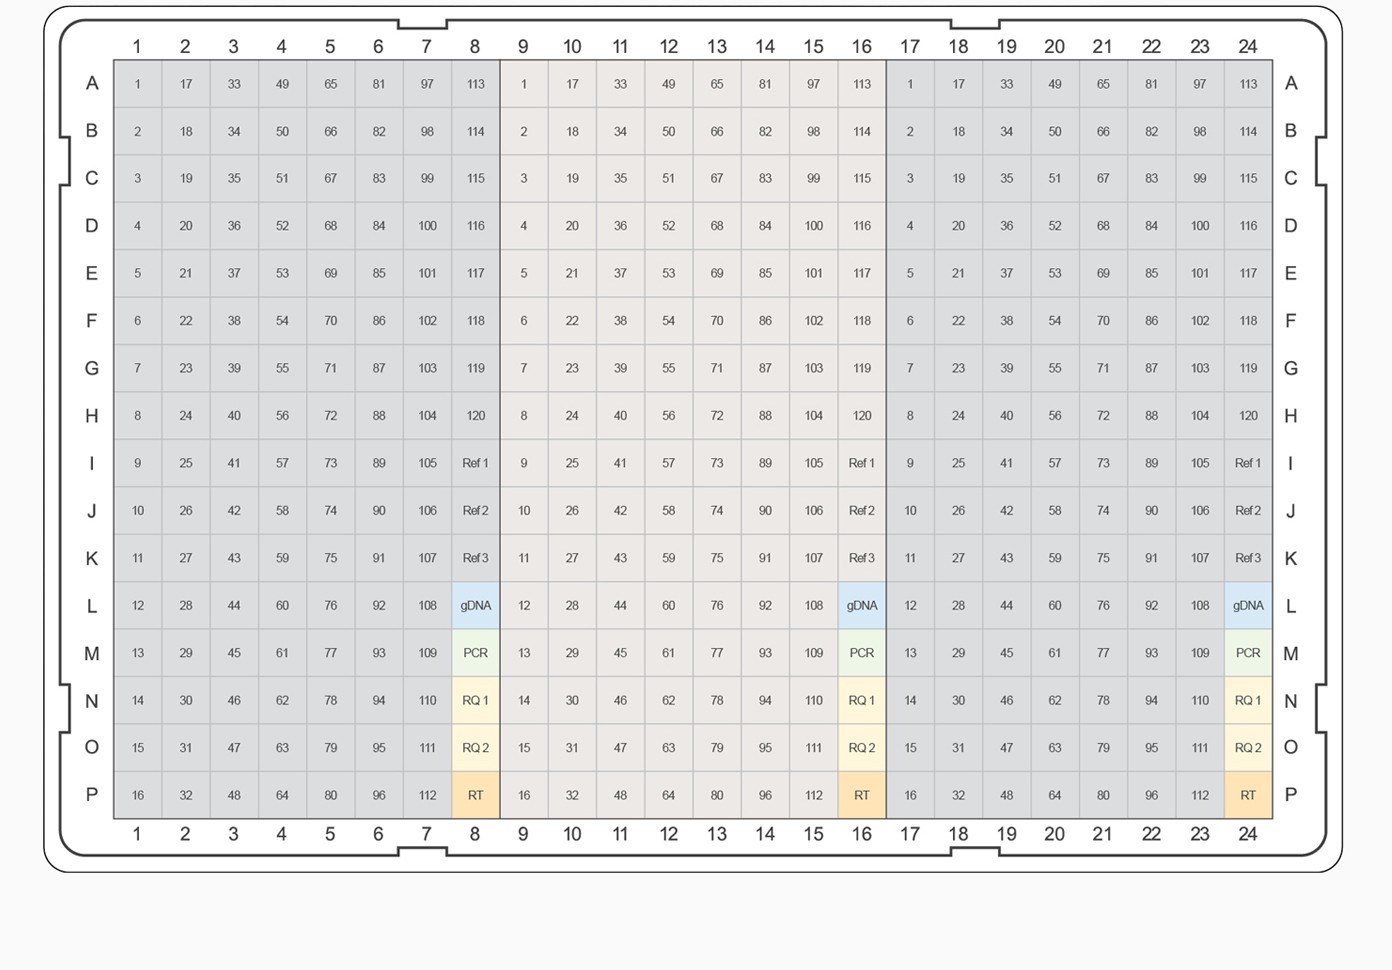
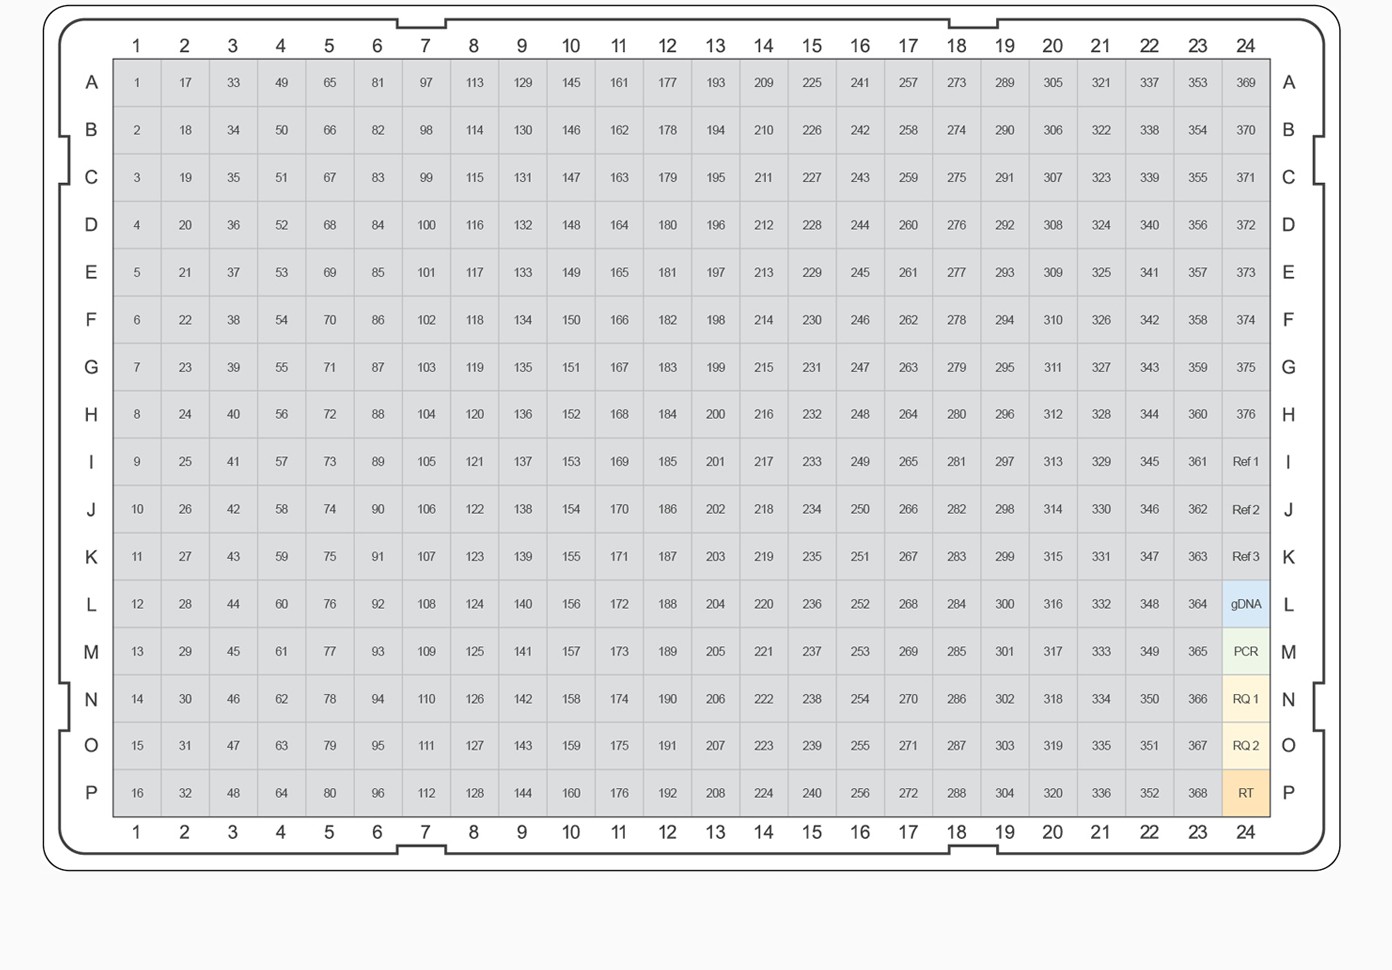
Fig. 3. PrimePCR pathway and collection panel templates. The top-ranked gene targets from each pathway and category were selected for inclusion on PrimePCR panels. PCR plate templates were selected to accommodate the largest number of gene targets while maximizing the number of experimental samples that will fit on a given 96- or 384-well plate format. Experimental samples are color-coded, alternating between gray and tan. Control assays are represented on the plate templates as follows: genomic DNA contamination control assay (gDNA), positive PCR control assay (PCR), RNA quality assay (RQ1 and RQ2), and reverse transcription control assay (RT). A–B, examples of 96-well plate templates; C–E, examples of 384-well plate templates.
For pathway-specific panels where the number of gene targets on the pathway didn’t completely fill the wells on the PCR plate, would-be empty wells were filled with the highest-ranked targets from the associated general category for the corresponding pathway map. For collection panels where multiple 96-well plates could be designed, the highest-ranking targets were combined on “Tier 1” plates, and lesser-ranked targets were used to complete Tier 2, 3, and 4 plates, respectively. This tiered system allows researchers the option to study well-characterized targets known to be of interest for a given biological process or to pursue less well-characterized candidates. For example, if the “Apoptosis and Survival — NGF Signaling Pathway” panel needed additional gene targets, the highest-ranking remaining targets from the “Apoptosis and Survival” collection would be used. For all panels, target assays were placed into the plate alphabetically to allow easy target identification in each pathway. In addition to target assays, a PrimePCR panel includes three reference genes and five experimental controls for each sample.
Conclusions
Pathway analysis provides an efficient and focused approach for studying a large number of related gene targets in a single experiment. The pathway curation and ranking strategy employed by Thomson Reuters and Bio-Rad ensures that the gene assays present on each real-time PCR pathway and collection panel are the most relevant for gene expression profiling based on differential expression studies and the frequency with which gene targets appear in the peer-reviewed literature. All PrimePCR assays were designed following strict guidelines on maximum transcript coverage, have minimal overlap with known single nucleotide polymorphisms, and span large introns where possible. In addition, they have all been fully validated in the lab, passing stringent quality controls. As a result, PrimePCR panels set a new quality standard for commercially available predesigned qPCR pathway panels.
Reference
Shmelkov E et al. (2011). Assessing quality and completeness of human transcriptional regulatory pathways on a genome-wide scale.
Biol Direct 6, 15.
Integrity and Web of Knowledge are service marks and MetaCore is a trademark of Thomson Reuters.
Practice of the polymerase chain reaction (PCR) may require a license.