Introduction
Protein thermal shift assays enable quick and easy buffer optimization for increased protein stability. Assays can be performed with higher throughput and more buffer systems than with traditional circular dicroism detection. Bio-Rad’s family of CFX Real-Time PCR Detection Systems uses a simple protocol, described herein, to measure protein thermal stability using SYPRO Orange Fluorescent Dye. SYPRO Orange binds to hydrophobic regions in denatured proteins, illuminating the presence of unstable proteins. In the example below, we adjusted pH and buffer salt concentration in order to optimize a Tris buffer used with β-galactosidase (Aspergillus oryzae) and validated using thermal shift assays.
Materials
Sample Preparation
The preparation below applies to our proof-of-concept case. For your own experiments, use the dyes and buffers that are most appropriate.
- SYPRO Orange Fluorescent Dye (final reaction 5x)
- 50 mM Tris buffers (we made 12 within a pH range of 3.5 to 9, 50 mM NaCl)
- Multiplate 96-Well PCR Plates; low profile, unskirted, clear (catalog #MLL9601)
- Microseal 'B' PCR Plate Sealing Film; adhesive, optical (#MSB1001)
- Protein resuspended in DI water (we prepared β-galactosidase to a final concentration of 1 mg/ml)
Equipment
CFX96 Touch Real-Time PCR Detection System (#1855195)
Procedure
Note: Each experimental condition was prepared in triplicate, per best practices. Sample data are also shown.
1. Protein Preparation
1.1 Resuspend protein of choice in DI water to an appropriate concentration.
1.2 Make a 50x stock solution of SYPRO Orange Dye by diluting 2.5 μl of 5,000x concentrate into 250 μl of DI water.
1.3 Aliquot 10 μl of protein solution into each well of a 96-well plate (this gave us a final protein mass of 10 μg of β-galactosidase).
1.4 Aliquot 2.5 μl of 50x SYPRO stock solution into each well of the same 96-well plate.
1.5 Aliquot 12.5 μl of each pH of buffer solution, in triplicate, to the 96-well plate for a final SYPRO concentration of 5x in each well.
1.6 Repeat the above step, instead creating an assay of protein samples where, for each pH level, a range of buffer salt concentrations is explored (50, 100, and 200 mM NaCl).
2. Melt Curve Analysis
Using the established thermal shift assay protocol (see section 3), β-galactosidase was first melted with increased pH and then with increases to both pH and buffer salt concentration using the CFX96 Touch System to generate protein melt curves.
2.1 Melt curves were constructed for pH levels from 3.5 to 9.0, in 0.5 intervals. Protein stabilization was observed between pH 4.5 and 6.0, with peak stability observed at pH 6.0 (67°C melt temperature) (Figure 1).
2.2 Exposing β-galactosidase to basic buffers past pH 6.0 caused destabilization of the protein and consequently lowered its melting temperature (Figure 1).
2.3 Varying buffer salt concentration over a similar pH range showed a similar trend in the melt curve shift was seen with only pH change (Figure 2).
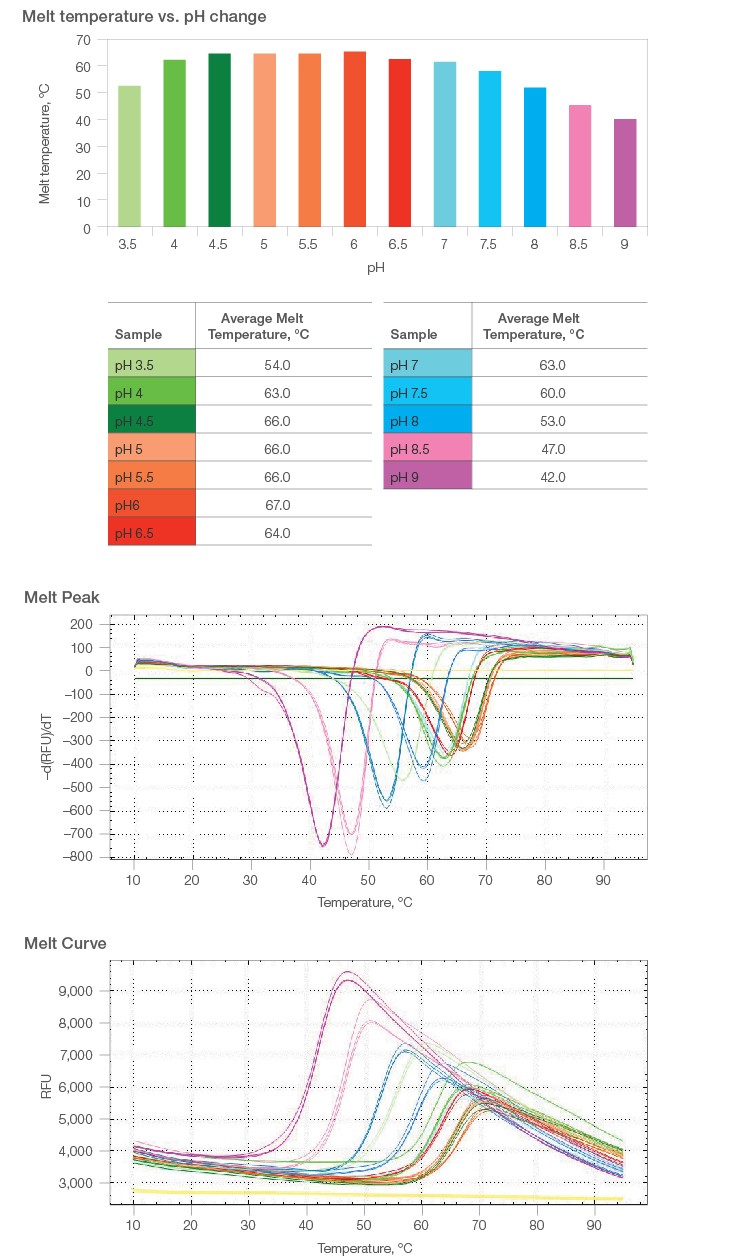
Fig. 1. Melt curve analyses over a range of pH levels.
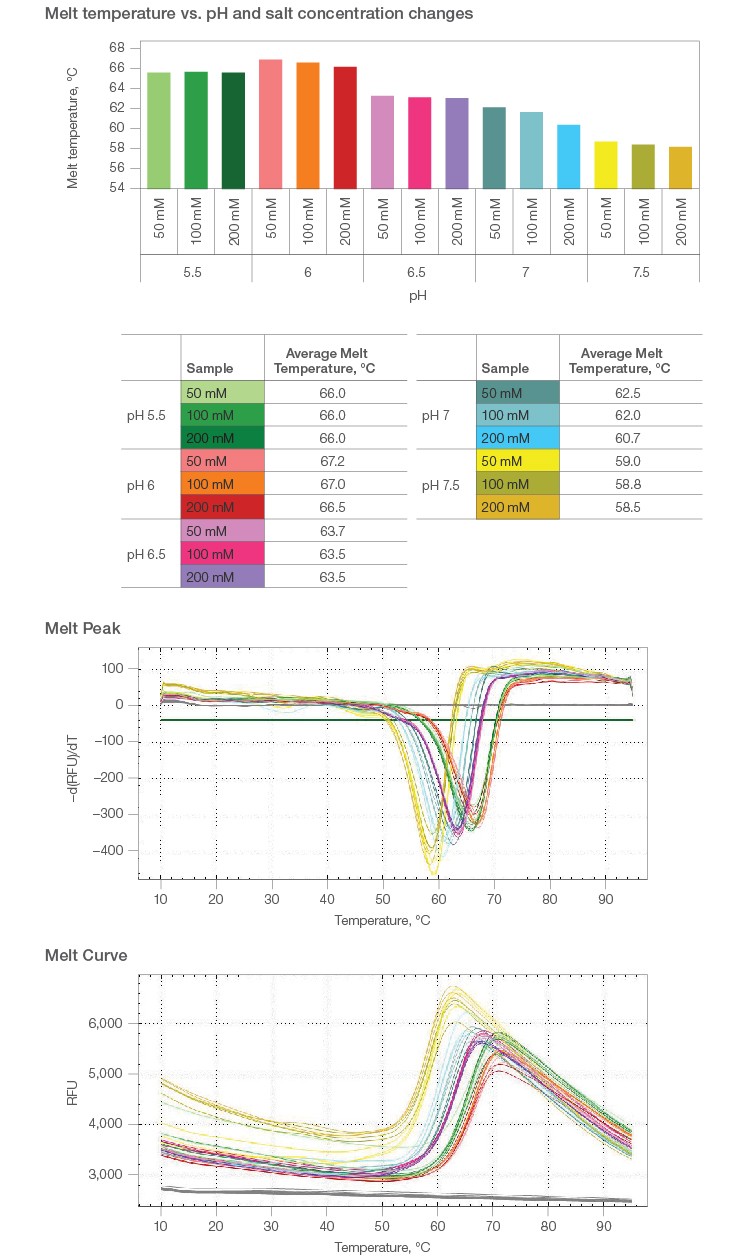
Fig. 2. Melt temperature analyses for increasing buffer salt concentration over a range of pH levels.
CFX Maestro Software Procedure
Note: A walkthrough of how to use your CFX Maestro Software to analyze melt temperatures is provided below.
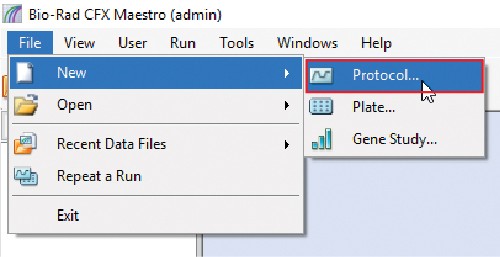
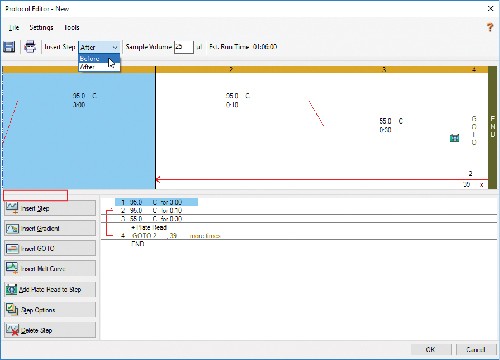
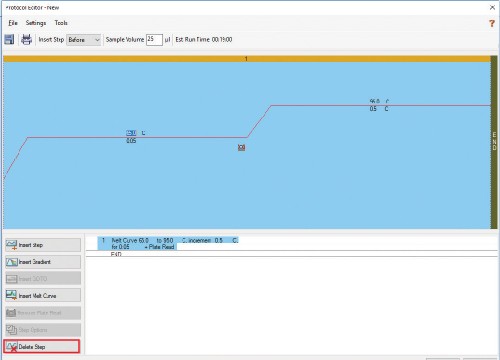
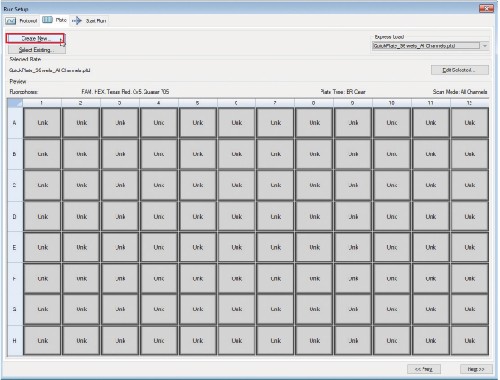
3. Protocol Setup
4. Plate Editing
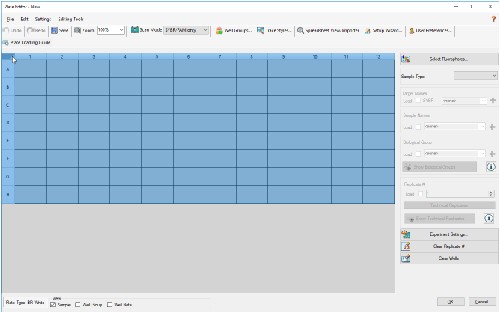
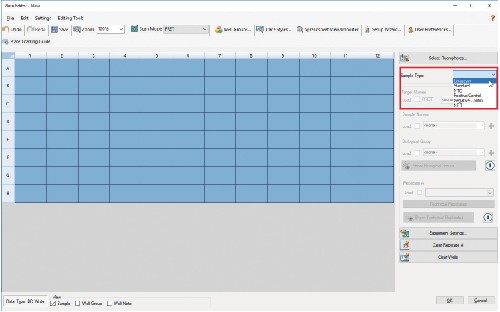
4.6 Make sure wells are still highlighted and check the Load box next to FRET under Target Names.
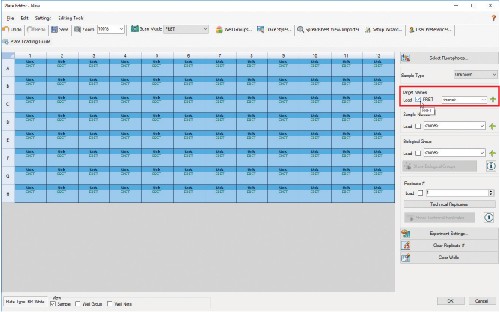
4.7 You can also add Sample Names and designate a Replicate # in this window.
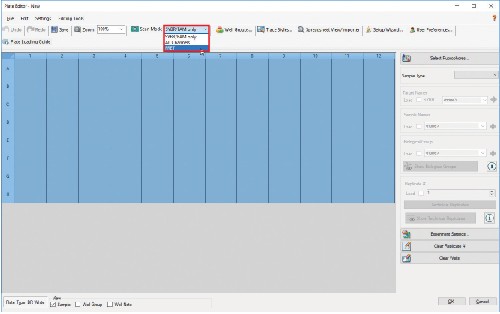
4.8 Before clicking OK, ensure that you have chosen a clear plate by clicking Settings > Plate Type > BR Clear.
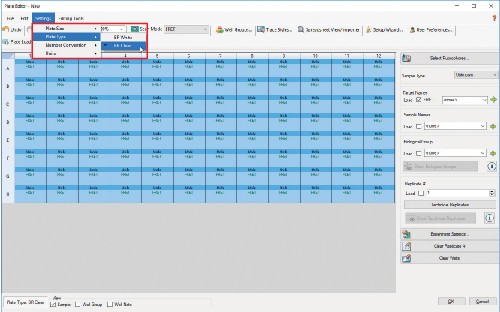
4.9 Click OK when you’re done editing the plate template.
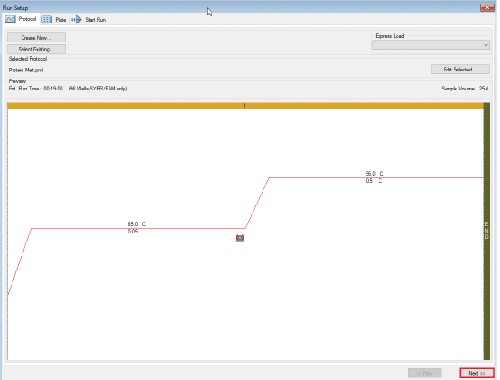
4.10 Click Next to get to the Start Run tab. Here you can add a description of the experiment and check the CFX System to use.
Summary
Instruments in Bio-Rad’s family of CFX Real-Time PCR Detection Systems accurately measure thermal shift, making them effective tools for buffer screening to find the ideal conditions that will maximize protein stability. All CFX Systems are compatible with CFX Maestro Software, which provides a straightforward interface for creating optimization protocols. For our example, we were able to easily observe changes in the stability of our chosen protein while adjusting buffer conditions. The experimental setup and analytical approach we used can serve as an adaptable template for others.