
Necroptosis is a programmed form of necrotic cell death that is dependent on activation of receptor interacting protein kinase-3 (RIPK3) and occurs when caspase activation is insufficient or blocked. Unlike necrosis, an unregulated form of cell death caused by external physicochemical stress, necroptosis is highly regulated and acts as a defense mechanism or escape route for cells infected with viruses that inhibit apoptosis signaling proteins (examples of these viruses include the murine cytomegalovirus, West Nile virus, human immunodeficiency virus-1 (HIV-1), and herpes simplex virus).
Table 1. Features of necroptosis, necrosis, and apoptosis.
| Necroptosis | Necrosis | Apoptosis |
| Programmed | Unprogrammed | Programmed |
| Cells swell | Cells swell | Cells shrink |
| Cell debris is released | Cell debris is released | Phagocytes/macrophages engulf cells |
| Process is inflammatory | Process is inflammatory | Process is noninflammatory |
Recent animal studies also indicate that necroptosis may regulate the number of T cells in peripheral tissues and is required for clearance of abnormal lymphocytes during T cell development. However, several pathological conditions have been associated with abnormal regulation of necroptosis. Several cancers, including breast and ovarian cancers, melanoma, and leukemia, are characterized by low expression and activity of necroptotic signaling proteins. In contrast, inflammatory pathologies, such as multiple sclerosis, myocardial ischemia-reperfusion injury, inflammatory bowel disease, and chronic obstructive pulmonary disease, are associated with elevated expression of necroptotic signaling proteins.
Necroptosis is often compared to apoptosis, another programmed cell death pathway. The two cell death pathways share several upstream signaling elements and eventually lead to plasma membrane rupture, but the cell morphologies of each process are drastically different. Necroptosis is characterized by increased cell volume, swelling of organelles, perforation of the plasma membrane, cellular collapse, release of cellular contents that triggers an innate and adaptive immune response, and clearance of the necroptotic cells by macropinosomes. Apoptosis, on the other hand, is characterized by cell shrinkage, membrane blebbing, condensation, margination of nuclear chromatin, packaging of apoptotic bodies, and engulfment of the immunogenic intracellular proteins by phagocytes and macrophages.
Necroptosis shares several upstream signaling elements with apoptosis, the most well-studied of which is tumor necrosis factor receptor 1 (TNFR1). TNFα binds to TNFR1 on the plasma membrane, which leads to recruitment of TNF receptor-associated death domain (TRADD) and, in turn, RIPK1. Under conditions that sensitize the cell to death, a cell death-inducing complex of RIPK1, Fas-associated protein via death domain (FADD), caspase-8, and cellular FLICE-like inhibitory protein (cFLIP) is formed.
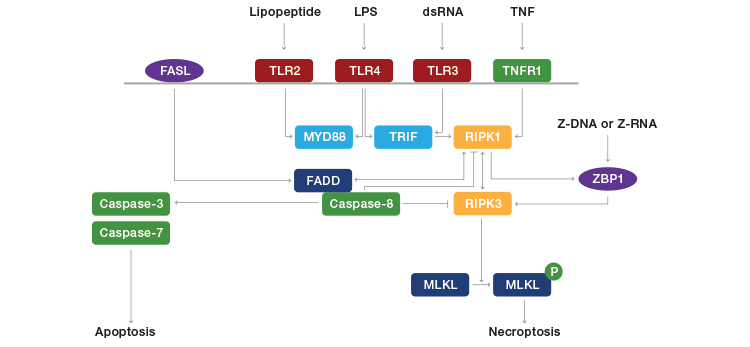
Fig. 1. Pathways leading to necroptosis. FASL, FAS ligand; TLR, toll-like receptor; TNFR1, tumor necrosis factor receptor 1; MYD88, myeloid differentiation primary response gene 88; TRIF, TIR-domain-containing adaptor-inducing interferon-β; RIPK, receptor-interacting protein kinase; FADD, FAS-associated cell death domain; ZBP1, Z-DNA binding protein 1; MLKL, mixed lineage kinase domain-like. Adapted from Jorgensen et al. (2017).
Caspase-8 is a key inhibitor of necroptosis, as it has been shown to cleave and inactivate RIPK1 and RIPK3. If caspase-8 is active, it forms a complex with RIPK1 and FADD to initiate apoptosis. If caspase-8 is inhibited, RIPK1 and RIPK3 interact with RIP homotype interaction motifs (RHIM) to initiate necroptosis. This leads to a series of auto- and cross-phosphorylations between RIPK1 and RIPK3 that lead to formation and activation of a cell death-inducing complex called a necrosome. Phosphorylation of RIPK3 leads to recruitment and subsequent phosphorylation of mixed lineage kinase domain-like protein (MLKL), which translocates to intracellular and plasma membranes and induces membrane permeabilization and rupture, either through calcium or sodium influx through ion channels or direct binding to membrane phosphatidylinositol phosphates (this is still controversial among experts).
Membrane rupture leads to the spilling of intracellular content into the organ and the release of damage-associated molecular patterns (DAMPs), such as interleukin (IL)-1α, IL-β, IL-33, and high-mobility group protein 1, into the extracellular space. The DAMPs send signals into the circulation to recruit immune cells to the damaged tissue and increase inflammation. Macropinosomes, a subcellular component of macrophages, clear the necroptotic cells through pinocytosis, a process of “cellular drinking” in which the broken-down cells are brought into the macropinosome and suspended within small vesicles that fuse with lysosymes to hydrolyze the cell.
RIPK3 may also be activated independently of RIPK1. DNA viruses (for example, murine cytomegalovirus) activate DNA-dependent activator of interferon regulatory factors (DAI) to phosphorylate RIPK3, and activation of toll-like receptor (TLR)3 or TLR4 by double-stranded RNA or lipopolysaccharides, respectively, activate toll/IL-1 receptor domain-containing adaptor inducing IFN-β (TRIF), which in turn phosphorylates RIPK3.
Table 2. Stages of necroptosis.
|
Necroptosis is activated following formation of a cell death-inducing complex in the setting of inactive caspase-8 |
|
Loss of plasma membrane integrity causes the cell to round and swell |
|
Perforation of the plasma membrane causes leakage of cellular content and cellular collapse |
|
The immune system initiates an inflammatory response to the leakage of cellular content and DAMPs |
|
Macropinosomes clear the necroptotic cells through pinocytosis, i.e., “cellular drinking.” |
Assessing necroptosis
A key challenge with identifying necroptosis is the need to distinguish it from apoptosis and secondary necrosis. Cells can readily shift from apoptosis to necroptosis (and vice versa), and secondary necrosis often occurs in the later stages of apoptosis in vitro. Therefore, detection of cell death should be complemented with real-time morphological analysis and/or inhibitor and knockdown approaches targeting death signaling pathways. Amount, rate, and synchrony of cell death within the cell population will also vary among cell types; therefore, sampling time after inducing cell death should be optimized prior to performing experiments.
Loss of plasma membrane integrity
Cell-impermeant dyes that bind to DNA, such as DAPI, propidium iodide (PI), or 7-AAD, identify the loss of plasma membrane integrity that occurs when cells die. When the plasma membrane ruptures, these dyes enter the cell and bind to the DNA, producing an intense fluorescence.
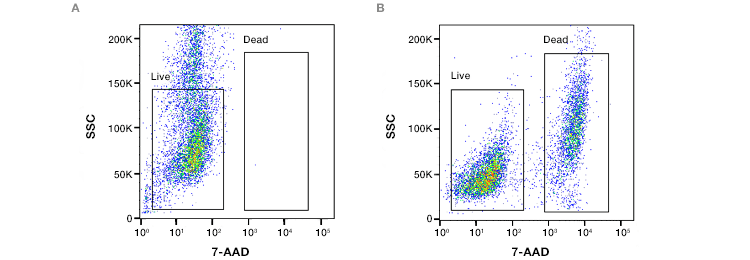
Fig. 2. Assessment of loss of cell membrane viability. ReadiDrop™ 7-AAD was added to (A) healthy Jurkat T cells and (B) cells that had lost their membrane integrity. Data collected on the ZE5™ Cell Analyzer.
Conventional flow cytometry and imaging flow cytometry with forward and side scatter detection provide information about cell size and morphology to differentiate between viable, necrotic, and apoptotic cells. In the early stages of necroptosis, cell swelling will cause both forward and side scatter measurements to increase, which is followed by rapid decreases upon disruption of the plasma membrane and leakage of cell constituents in the late stages.
Staining with annexin V in conjunction with PI is frequently used to separate cells into healthy (annexin V- and PI-negative), early apoptotic (annexin-V positive, PI-negative), and late apoptotic/secondary necrotic and necroptotic (annexin V- and PI-positive). To further distinguish the late apoptotic/secondary necrotic from the necroptotic cells, image-based analysis can identify differences in morphology. Cells undergoing necroptosis show diffuse PI staining and an intense fluorescence signal, whereas cells undergoing late apoptosis/secondary necrosis are shrunken in size, with annexin V-positive blebs and spots of high-intensity PI staining corresponding to condensed chromatin.
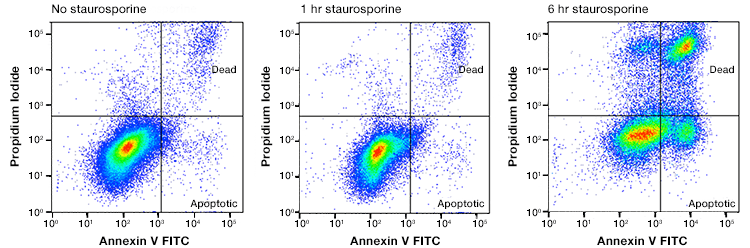
Fig. 3. Annexin and PI staining to distinguish healthy cells from apoptotic, necrotic, and necroptotic. Jurkat cells were treated with staurosporine at 1 mM for 0, 1, and 6 hr. The cells were stained with annexin V:FITC and ReadiDrop Propidium Iodide. Cells in different stages of apoptosis and late apoptotic/secondary necrotic can be seen. Necroptotic cells are to be found in the top right quadrant. Data collected on the ZE5 Cell Analyzer.
Staining of cell nuclei with PI can also help distinguish between primary necroptotic and secondary necrotic cells. Cells undergoing necroptosis have maintained chromatin structure and prominent nucleoli staining, whereas the DNA in apoptotic cells undergoing secondary necrosis has homogeneous staining due to the loss of chromatin structure and internucleosomal cleavage.
One advantage of using biophysical properties (that is, fluorescence) over enzyme-based assays (for example, MTT assays) to assess cell death is that biophysical assays are not affected by conditions that alter enzymes involved in respiration. However, addition of fluorescent experimental compounds can interfere with the assay by quenching or auto-fluorescence, which can under- or overestimate cell death, respectively. Complementing these experiments with non-fluorescent approaches will help confirm results in this experiment.
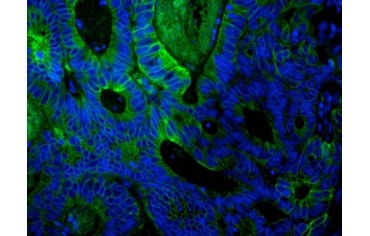
Fig. 4. Paraffin section of human colon adenocarcinoma stained with PureBlu™ Hoechst 33342. After heat-induced epitome retrieval (HIER) with citrate pH 6 antigen, the tissue was blocked with 10% FCS and stained with mouse anti-human cytokeratin 18 and detected with goat anti-mouse IgG:A488.
Cell preparation is another important consideration. If you are working with adherent cell lines, they must be detached from the culture plate or flask before the flow cytometry experiment. If possible, cells should be grown in suspension to avoid possible cell damage or permeabilization caused by cell detachment procedures, and the ability to grow in suspension should be tested beforehand. If growth in suspension is not possible, high-content microscopy with PI/Hoechst staining may be used to analyze adherent cells.
Determination of cell death in vivo
The occurrence of cell death in tissues and organs can be identified by the presence of cellular content, such as lactate dehydrogenase (LDH) or mitochondrial DNA, in the plasma, although these components alone do not specify the pathway by which cell death occurred. Release of high mobility group box 1 protein (HMGB1), IL-1α, IL-33, and cyclophilin A may indicate that necroptosis has occurred, but high levels of these molecules may be present with macrophage activation or extensive apoptosis (which may result in secondary necrosis). Detection of posttranslational modifications is often used for detecting apoptosis, but no unique marker exists for necroptosis. Therefore, real-time assessment of morphology, such as time-lapse video microscopy or transmission electron microscopy (described below) can confirm that cell death has occurred via necroptosis.
Mitochondrial transmembrane potential
Fluorescent probes, such as tetramethylrhodamine methyl ester (TMRM), Rhodamine 123, tetramethylrhodamine ethyl ester (TMRE), or JC-1, accumulate and fluoresce brightly in the mitochondria with intact membrane potentials (that is, non-apoptotic or non-necrotic). Hyperpolarization of the MTP has been shown in the early stages of necroptosis (shortly before the initiation of cell rounding), which results in a transient increase in the fluorescence. Plasma membrane rupture dissipates the MTP and results in a corresponding decrease in fluorescence. Because most fluorescent probes for measuring MTP are single-wavelength indicators that change their fluorescence intensity proportional to a stimulus, fluorescence intensity should be measured at baseline and after stimulation as a function of time. These measurements can be obtained using flow cytometry, fluorescent microscopy, or a fluorescent plate reader. Get more detailed information on how to measure apoptosis.
Morphology
The morphology of cells undergoing cell death is highly dynamic; therefore, measuring the process over time is essential for confirming necroptosis. Time-lapse video microscopy with epifluorescence can connect morphological changes in individual cells with molecular, subcellular, and biochemical events and enable distinction between necroptosis and apoptosis. Cell-impermeant DNA-binding dyes, namely PI, can determine plasma membrane permeability and distinguish between necroptosis and secondary necrosis. Time-lapse images are recorded using differential interference contrast (DIC) or phase contrast optics. An important consideration is to optimize the light exposure for each cell type and fluorescent probe to reduce phototoxicity and minimize experiment-induced cell death. In general, short exposure times, low lamp voltage, a small number of z sections and time frames, and pixel binning on the camera help minimize risk for cell damage.
Transmission electron microscopy, although time-consuming and expensive, is often considered a gold standard for assessing morphology because it produces images of cell morphology at high resolution and magnification. However, preparing cells for electron microscopy may damage their morphology; therefore, additional methods may be needed to maintain the cell integrity (one method in Vanden Berghe et al. (2013) describes using macrophages attached to the bottom of tissue culture plates to capture dying cells).
The time point at which you assess morphology after induction of cell death will also need to be optimized depending on the kinetics of cell death for each cell line and death inducer. A cell undergoing necroptosis will show swelling of the cell and cytoplasmic organelles, followed by rapid loss of plasma membrane integrity.
Inhibitor and knockdown strategies
Pan-caspase chemical inhibitors, such as zVAD-fmk or Q-VD-OPh, are often used to block caspase activation to cell death and/or confirm the occurrence of necroptosis. Although these caspase inhibitors can block most of the extrinsic signals for apoptosis, they likely do not completely block the intrinsic pathway of apoptosis, in which the role of caspases is to accelerate cell death following the irreversible loss of mitochondrial membrane potential.
Necrostatin-1 (a RIPK1 inhibitor) and necrosulfonamide (an MLKL inhibitor) are commonly used to block necroptosis experimentally. However, necrostatin-1 may also induce RIPK1-mediated apoptosis in some cells and is not specific enough to differentiate between necroptosis and apoptosis. Thus, additional knockdown strategies are needed to corroborate data from experiments using inhibitor strategies.
Knockdown of RIPK3 or MLKL can block necroptotic cell death; however, interference with a cell death pathway often results in a shift to another cell death pathway (for example, apoptosis). Therefore, it is important to analyze the type of cell death (via imaging flow cytometry and/or real-time imaging mentioned above) that occurs after knockdown.
Antibodies
Measuring key proteins in the necroptosis pathway, namely RIPK3 (Figure 5), RIPK1 (Figure 6), and MLKL, using western blot, immunohistochemistry, or flow cytometry can support real-time morphology experiments. Phospho-MLKL at Ser358 and Thr357 is the most precise protein to confirm necroptosis via RIPK3-mediated activation of MLKL. Measuring protein content of procaspase-8 or cleaved caspase-8 (43/41 kD) can indicate whether low levels of procaspase-8 or insufficient caspase-8 activation, respectively, are favoring necroptosis. Additionally, a high ratio of RIPK1/procaspase-8 may also suggest favorable conditions for necroptosis.
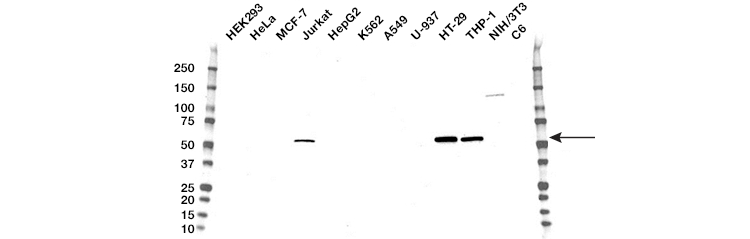
Fig. 5. Western blot analysis of whole cell lysates. Blot probed with RIP3 antibody followed by detection with HRP-conjugated goat anti-mouse IgG (1/10,000) and visualized on the ChemiDoc™ MP Imager with 120 second exposure. Arrow points to RIP3 (molecular weight 57 kD).
Inducing activation of the TNF receptor in the presence or absence of a necroptosis inhibitor (for example, necrostatin-1 or necrosulfonamide), followed by harvesting of cells at multiple time points and immunoblotting with phosphorylated RIPK1 and RIPK3, can also determine whether cell death is occurring via necroptosis. Immunocytochemical analysis can also be used to detect localization of MLKL to the plasma membrane during necroptosis using a fluorescent tag, such as green fluorescent protein.
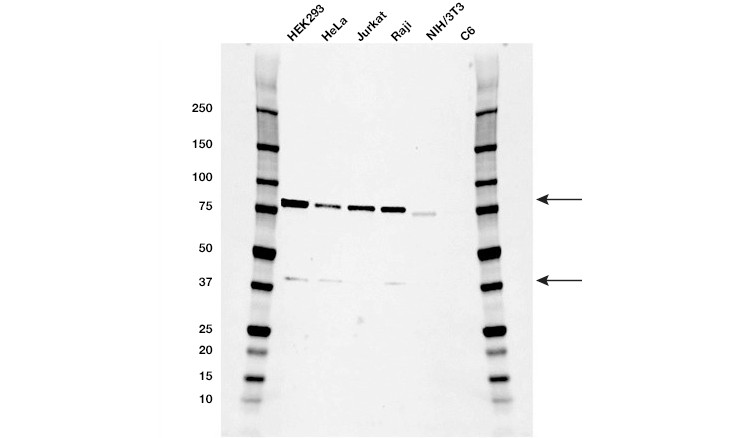
Fig. 6. Western blot analysis of whole cell lysates. Blot probed with RIPK1 antibody followed by detection with HRP-conjugated goat anti-mouse IgG (1/10,000) and visualized on the ChemicDoc MP Imager with 21 second exposure. Arrows point to RIPK1 (molecular weight 78 and 38 kD).
Conclusion
Although necroptosis is the most well-characterized form of regulated necrosis, several other pathways of regulated cell death have been identified, including pyroptosis, ferroptosis, parthanatos, cyclophilin D-dependent necrosis, and NETosis. However, these pathways do not work in isolation. For example, if a pathogen inhibits caspase-1 (essential for activation of pyroptosis), the small adaptor protein ASC that activates caspase-1 during pyroptosis can activate caspase-8 and trigger cell death via apoptosis. Therefore, potential crosstalk and interactions between pathways will need to be accounted for when studying pathways of programmed cell death in the future. Current strategies of using real-time morphological analysis, along with inhibition or knockdown of specific pathways, will help clarify the roles of and conditions in which some of these new pathways function.
Table 3. Summary of assays for detecting hallmarks of necroptosis.
| Necroptosis stage | Reagents to allow detection | Application |
| Loss of membrane integrity | DAPI, Hoechst, PI, 7-AAD | Flow cytometry, microscopy |
| Distinguish from apoptosis: Phosphatidylserine flipping |
Annexin-V conjugates, pSIVA probes | Flow cytometry, microscopy |
| Distinguish from apoptosis: Mitochondrial outer membrane permeabilization |
TMRM, TMRE, JC-1 | Flow cytometry, microscopy, microplate reader |
| Morphology | Microscopy | |
| Key protein detection | RIPK3, RIPK1, MLKL, procaspase-8 cleaved caspase-8 |
Western blot, microscopy, flow cytometry |
| Death receptor activation | Death receptor antibodies TNFR1 TNFR2 FAS TWEAK receptor TRAIL receptors |
Western blot, flow cytometry |
References
Jorgensen I et al. (2017). Programmed cell death as a defence against infection. Nat Rev Immunol 17, 151–164.
Vanden Berghe T et al. (2013). Determination of apoptotic and necrotic cell death in vitro and in vivo. Methods 61, 117–129.
Hoechst is a trademark of Hoechst GmbH. pSIVA is a trademark of Novus Biologicals.