The power of gene editing provides the ability to change the biology of a cell or whole organism, enabling the investigation of a host of difficult or previously impossible to interrogate biological processes. As more and more gene editing tools are discovered and developed, the applications for gene editing will only continue to expand. Here we use CRISPR-Cas9 editing of intracellular adhesion molecule-1 in a prostate cancer cell line to illustrate a method that incorporates enrichment and single-cell sorting to allow monocultures of edited cells to be generated in a reliable and more rapid manner.
Introduction
Intracellular adhesion molecule-1 (ICAM-1) plays an important role in stabilizing cell-cell interactions and in mediating cell signaling during the immune response. It is a cell surface glycoprotein typically expressed in immune and endothelial cells and binds to integrins. ICAM-1 expression can be stimulated by interleukin-1 (IL-1) and tumor necrosis factor alpha (TNFα), which facilitates leukocyte extravasation through endothelial cells into underlying tissue. ICAM-1 expressed by respiratory epithelial cells is also the binding site for rhinovirus, the causative agent of most common colds. Additionally, ICAM-1 is associated with a variety of cancer cell types and has been shown to play both a positive and a negative role in cancer cell invasion and metastasis. To investigate the effect of decreased ICAM-1 expression on various cell signaling pathways, we analyzed gene and protein expression in a cellular knockout of ICAM-1. We found that a reduction of ICAM-1 expression through CRISPR-mediated gene editing altered gene and protein expression in the prostate cancer cell line PC3. In addition, we demonstrate a streamlined method for CRISPR gene editing that includes enrichment and single-cell sorting flow cytometry.1. Transfection
After designing your gene editing strategy, the first step in the CRISPR gene editing workflow is to identify the best method for delivering the CRISPR-Cas9 system into your cells of interest, be they animal or human, tumor-derived or wild type. Transfer efficiency and subsequent cell viability are very important when considering which method to use. We designed a knockout strategy that uses knock-in of a donor template containing the GFP and puromycin resistance genes to disrupt ICAM-1. PC3 cells were transfected using either TransFectin™ Lipid Reagent or the Gene Pulser Xcell™ Electroporation System. GFP fluorescence was used as an initial readout for successful transfection (Figure 1).Fig. 1. Optimizing transfection efficiency. PC3 cells (ATCC) were cultured in Ham’s F-12 Nutrient Mix (GIBCO) with 10% HyClone FBS (GE Healthcare), 1% Penicillin-Streptomycin (GIBCO) and maintained at 37°C and 5% CO2 for 7 days. Prior to transfection, cells were counted using the TC20™ Automated Cell Counter. One of two different CRISPR-Cas9 plasmids targeting ICAM-1 (OriGene) and a donor vector containing left and right homologous arms as well as a GFP-Puro functional cassette (OriGene) were transfected into PC3 cells using either the Gene Pulser Xcell Electroporation System or lipid-mediated transfection with TransFectin Lipid Reagent. Media of both electroporated and TransFectin treated cells was replaced with fresh growth media 24 hours after treatment. The ZOE™ Fluorescent Cell Imager was used to assess GFP expression in transfected cultures and showed that the plasmids had been successfully transferred into cells. Merged (A) and GFP channel (B) view of PC3 cells 24 hours after transfection using the Gene Pulser Xcell System captured using the ZOE Fluorescent Cell Imager. TransFectin and the Gene Pulser Xcell System provided similar levels of transfection efficiency (data not shown).
2. Enrichment and Single-Cell Isolation
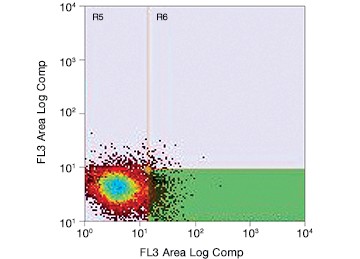
Fig. 2. Gating for live (PI-negative) GFP-positive transfected PC3 cells using the S3e Cell Sorter. Cells were enriched for GFP, resulting in selection of potentially edited cells for further culture.


Fig. 3. Comparison of enriched and nonenriched cultures. Transfected cells were cultured for 14 days. The live GFP-positive cell population was enriched from the mixed cell culture using the S3e Cell Sorter. Puromycin selection 14 days later further selected for edited cells. Significantly more puromycin resistant cells were available earlier for single-cell sorting from the enriched population (A) than the nonenriched cultures (B). Live GFP-positive cells were sorted using the S3e Cell Sorter and single-cell isolation and GFP fluorescence were confirmed using the ZOE Cell Imager (data not shown). Cells were then passaged for 2 weeks until 80% confluent for further analysis.

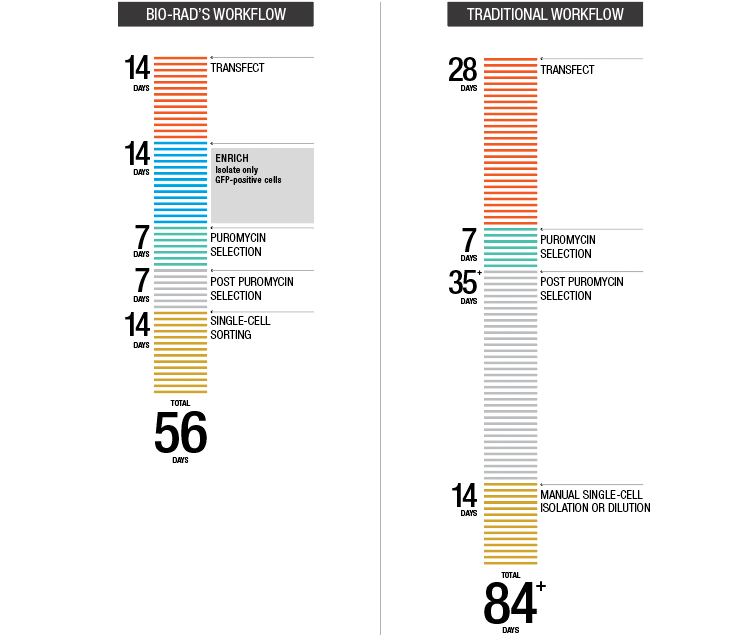
Fig. 4. Accelerated target cell enrichment.
3. Confirmation of Edits
Once you have enriched your cells of interest, you need to confirm that you have successfully edited your target cells before moving on to downstream assays. This can be accomplished through direct detection of edits using genomic methods or through indirect detection using cellular or proteomic methods. Protein analysis by western blot (Figure 5) and immunocytochemistry (ICC, Figure 6) showed a complete loss of ICAM-1 expression in our edited cells.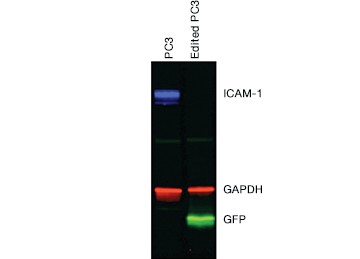
Fig. 5. Confirmation of successful gene editing by western blot. Control and edited cells were lysed on ice in RIPA buffer (VWR) containing protease inhibitor cocktail (VWR), sonicated, and spun down to remove particulates. Lysates were centrifuged again and the supernatant was diluted in 4x Laemmli Sample Buffer containing b-mercaptoethanol and run on a 12% acrylamide precast stain-free gel. Proteins were transferred to nitrocellulose for 7 minutes at 100 V using the Trans-Blot® Turbo™ Transfer System. The blot was blocked with 1x Tris buffered saline (TBS) with 1% casein and then rinsed with 1x phosphate buffered saline Tween 20. CD54 PrecisionAb™ Primary Antibody recognizing ICAM-1, Goat Anti-Rabbit IgG StarBright™ Blue 700 (red), Anti-GAPDH hFAB™ Rhodamine Labeled Primary Antibody (blue), and Anti-turboGFP Primary Antibody (OrigGene) (green) were applied. The blot was imaged on the ChemiDoc™ MP Imaging System.
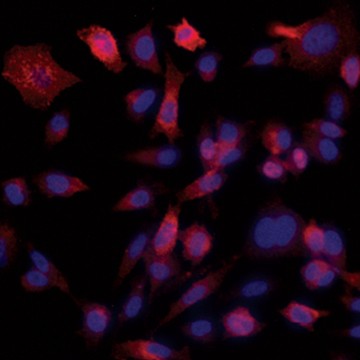
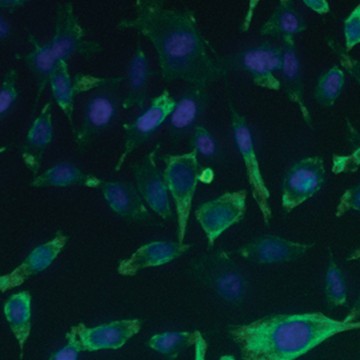
Fig. 6. Confirmation of successful gene edits by immunocytochemistry. Control and edited cells were plated onto microscope slides 48 hours prior to staining with anti-ICAM-1 antibody (red), and DAPI (blue)-containing mounting medium. Slides were imaged at the bench using the ZOE Cell Imager. Edited cells show expression of GFP but no ICAM-1 expression. A, immunostaining of control PC3 cells reveals abundant ICAM-1 expression. B, CRISPR-edited PC3 cells have lost ICAM-1 expression and gained stable GFP expression.
4. Downstream Analysis
Now that you have confirmed that your cells are correctly edited, you can begin to investigate their phenotype. You may even wish to further perturb your system with a drug as part of a cell-based assay during target or lead discovery and validation. Using PrimePCR™ Real-Time PCR Assays and Bio-Plex® Multiplex Immunoassays, we were able to show gene and protein expression of ICAM-1 in our knockout cell lines upon stimulation with TNFα, albeit to a lesser extent than in control unedited PC3 cells. We found expression changes in a number of genes and proteins related to the extracellular matrix and other cell signaling pathways (Figure 7 and data not shown).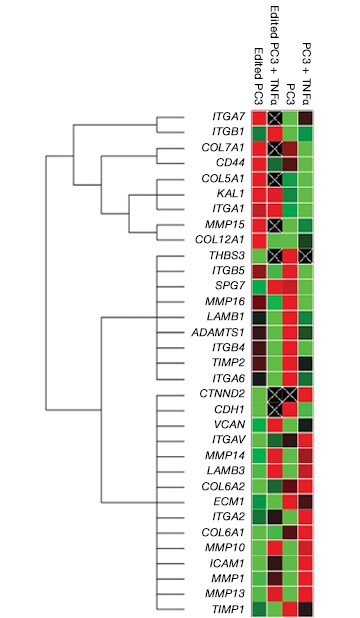
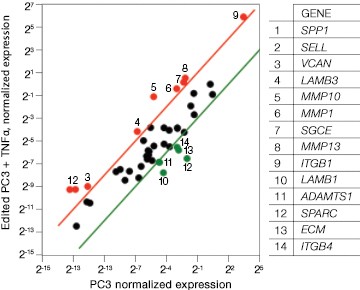
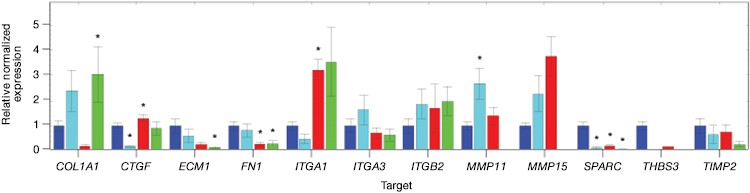
Fig. 7. Gene expression analysis in control and edited cells in response to TNFα treatment. Control and edited cells were treated with TNFα to stimulate ICAM-1 expression. RNA was prepared using the Aurum™ Total RNA Mini Kit and cDNA was prepared using the iScript™ gDNA Clear cDNA Synthesis Kit. cDNA were added to three different PrimePCR Predesigned 384-Well Pathway Plates: Male Urogenital Diseases Tier 1, Extracellular Matrix, and Neoplasm Metastasis. We screened 962 targets by real-time PCR to look for changes in gene expression using a CFX384 Touch™ Real-Time PCR Detection System and analyzed resulting data using CFX Maestro™ Software. A, relative normalized expression plot shows little or no change in expression of ICAM-1 in edited cells compared to wild-type PC3 in response to TNFα treatment. These results also show that edited cells retained a low level of ICAM-1 expression. B, a scatter plot provides an alternate view of changes in expression. The red line represents a fourfold increase and the green line a fourfold decrease in expression compared to control cells (unstimulated wild-type PC3 cells); C, interestingly other cell adhesion markers showed altered expression between wild-type and edited PC3 cells before and after stimulation with TNFα, suggesting that cells are using these gene products to compensate for lack of an ICAM-1. PC3 (—); PC3 + TNFα (—); edited PC3 (—); edited PC3 + TNFα (—).
Conclusions
Enrichment of transfected cells by flow cytometry saves time, reduces cell culture waste, and increases the chances of selecting and growing successfully edited colonies. Reducing the level of ICAM-1 expression in PC3 cells affects other cell signaling pathways involved in extracellular matrix remodeling and cell signaling under both basal and stimulated conditions.HyClone is a trademark of GE Healthcare Group companies. GIBCO is a trademark of Thermo Fisher Scientific. turboGFP and OriGene are trademarks of OrigGene Technologies, Inc. VWR is a trademark of VWR International, LLC. Tween is a trademark of ICI Americas Inc.
The Bio-Plex Suspension Array System includes fluorescently labeled microspheres and instrumentation licensed to Bio-Rad Laboratories, Inc. by the Luminex Corporation.
Bio-Rad’s thermal cyclers and real-time thermal cyclers are covered by one or more of the following U.S. patents or their foreign counterparts owned by Eppendorf AG: U.S. Patent Numbers 6,767,512 and 7,074,367.