Abstract
Magnetic bead–based assays are widely used for the quantitation of relevant biomarkers implicated in various diseases. The Bio-Plex Pro RBM Apoptosis Assays enable multiplex measurement of biomarkers involved in the intrinsic apoptosis pathway. This report describes the development and validation of the apoptosis assay panels and provides performance characteristics, such as assay working range, sensitivity, precision, linearity of dilution, and parallelism for these assay panels.
Introduction • Results • Conclusions • References
Figures
Bcl-2 Family Proteins

Fig.1. Schematic classification of selected Bcl-2 family proteins.
Sensitivity of Bio-Plex Pro RBM Apoptosis Assays vs. Western Blots

Fig. 2. Comparison of sensitivity of Bio-Plex Pro RBM Apoptosis Assays and immunoprecipitation western blotting.
Linearity of Dilution

Fig. 3. Linearity of dilution of Bio-Plex Pro RBM Apoptosis Assays.
Assay Parallelism

Fig. 4. Parallelism of Bio-Plex Pro RBM Apoptosis Assays.
Apoptosis Biomarker Detection

Fig. 5. Detection of apoptosis biomarkers in colon cancer tissue.
Drug-Induced Apoptosis Biomarker Detection

Fig. 6. Detection of apoptosis biomarkers induced with gossypol, ABT-263, and HA14-1.
Evaluation of Bio-Plex Pro RBM Apoptosis Assays on Different Bio-Plex® Instruments

Fig. 7. Comparison of standard curve and controls using Bio-Plex® MAGPIX™ , Bio-Plex 3D and Bio-Plex 200 Systems.
Introduction
Apoptosis (programmed cell death) refers to a genetically controlled process by which cells die following programmed physiological or pathological conditions. Regulation of apoptosis is a delicate process and defects in this process are observed in a wide range of diseases (Rutledge et al. 2002). Excessive apoptosis is implicated in nonproliferative diseases including spinal muscular atrophy, AIDS, Alzheimer’s disease, myocardial infarction, and stroke. In contrast, inhibition of apoptosis is linked to almost every known human malignancy.
Currently the accepted models of cell death activation are associated with the Bcl-2 family of proteins, which are key regulators of this process. At least 17 human Bcl-2 proteins have been identified, each characterized by up to four regions of Bcl-2 homology (BH). The BH domains are crucial for the functioning of the proteins and are used to categorize family members into four distinct groups (Figure 1). The first group comprises anti-apoptotic proteins, which include Bcl-2, Mcl-1, Bcl-xL, and Bcl-w. The second group consists of pro-apoptotic proteins with three BH domains, including Bax, Bak, and Bok (Dewson and Kluck 2010, Lindsay et al. 2011, and Kuwana and Newmeyer 2003). The third group also comprises pro-apoptotic proteins, which possess the BH3-domain along with the transmembrane domain (includes Bim and Bik). The fourth group also carries the BH3-domain but without the transmembrane domain (includes Bad, Bid, and Puma). The BH3 domains of the pro-apoptotic Bcl-2 proteins can form heterodimers with the anti-apoptotic Bcl-2 proteins, thus altering the function of Bcl-2 and its homologs.
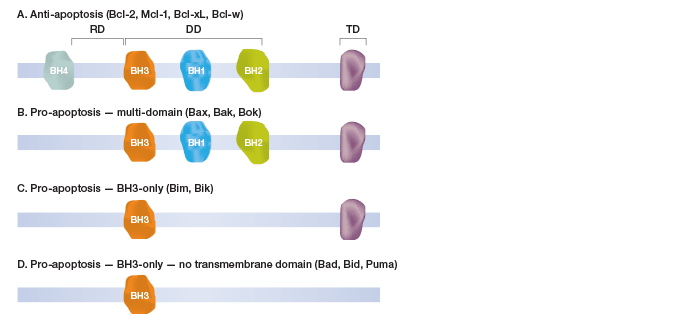
Fig. 1. Schematic classification of selected Bcl-2 family proteins.
Measurement of the Bcl-2 family of proteins by multiplex immunoassay is a novel method for evaluating pathways based on protein dynamics rather than on absolute protein levels alone. The Bio-Plex Pro RBM apoptosis assays measure key pharmacodynamic biomarkers relevant to the commitment, onset, and induction of apoptosis by the intrinsic pathway. Quantification of these biomarkers in tumor biopsies in early clinical trials will assist in confirming the intended mechanism of action of investigational agents and their efficacy, as well as toxicity. In-depth study of these biomarkers will also help to elucidate the dynamic changes in both pro- and anti-apoptotic proteins during the onset of apoptosis, and to expand therapeutic opportunities during drug discovery.
Results
Bio-Plex Pro RBM Apoptosis Assays
Bio-Plex RBM apoptosis assays, which were developed in collaboration with Myriad RBM, the Science Applications International Corporation (SAIC), and Frederick National Laboratory for Cancer Research, were used in this study. Three separate panels of magnetic bead–based assays were devoloped using Luminex xMAP technology to enable multiplex measurement of proteins involved in the intrinsic apoptosis pathway (Table 1). Reagents and protocols are provided in the kits for the preparation of total lysates, as well as lysate fractions such as nuclear + mictochondrial (N + M) and cytosolic fractions.
Table 1. Bio-Plex Pro RBM apoptosis assays.

Note: Species specificity is primarily human, as limited cross-reactivity was observed in rat and mouse samples. Contact Bio-Rad Technical Support for available data.
Overview of the Bio-Plex RBM Assay Workflow
The Bio-Plex Pro RBM magnetic bead–based assays employ a standard capture sandwich immunoassay method using a 96-well plate format. The capture antibody-coupled beads are allowed to react with a sample containing the target of interest (incubation time: 60 min). After performing a series of washes to remove unbound materials, a biotinylated detection antibody specific for a different epitope on the target is added to the beads (incubation time: 60 min). The result is the formation of a sandwich of antibodies around the specific target. The reaction mixture is detected by the addition of a reporter dye, streptavidin-phycoerythrin (SA-PE), which binds to the sandwich complexes via the biotinylated detection antibodies (incubation time: 30 min). The contents of each well are drawn up into the Bio-Plex® suspension array system, which identifies and quantifies each specific reaction based on bead color and fluorescence signal intensity. The magnetic beads are employed to enable automation of wash steps using a Bio-Plex Pro wash station and to ensure compatibility with all Luminex-based life science research instruments.
Data acquisition in this study was performed using the Bio-Plex 200 system at low PMT (RP1) setting, the Bio-Plex 3D system at standard PMT setting, or the Bio-Plex® MAGPIX™ system using the default setting.
The performance of these assays was evaluated according to standard verification and validation parameters, including assay specificity and sensitivity, precision, accuracy, working ranges, and linearity of dilution in lysate.
Assay Performance and Quality
Assay specificity was examined by performing single-detection cross-reactivity weighted on the highest standard point in recombinant (standard diluent) and native cell lysate matrices. The study was conducted by testing the individual detection antibody in the presence of multiplexed antigens and capture beads. The degree of cross-reactivity (defined as the percentage of signal detected relative to the specific signal for that analyte) was calculated for all the analytes (Table 2). The Bcl-xL/Bak and Mcl-1/Bak assays were expected to cross-react with each other due to sharing of the Bak detection antibody, which is specific for the Bak domain in both of the heterodimer assays. This cross-reactivity does not impact assay performance, as the specificity of these assays is conferred by their specific capture antibodies.
Table 2. Single-detection cross-reactivity.

Note: Cells highlighted in orange indicate cross-reactivity due to shared Bak detection antibody.
Assay working range is defined as the range between the lower limit of quantification (LLOQ) and the upper limit of quantification (ULOQ) in which an assay is both precise and accurate. LLOQ and ULOQ were defined as the point at which the coefficients of variance (%CV) for samples was ≤30% and ≤20% respectively, with an accuracy of 80–120%. The results are tabulated in Table 3.
Assay sensitivity, defined as limit of detection (LOD), was determined by adding two standard deviations to the average of the median fluorescence intensity (MFI) for ten replicates of the standard curve blank run on three separate plates. The value was converted to concentration as interpolated from the standard curve (Table 3).
Table 3. Representative assay performance.
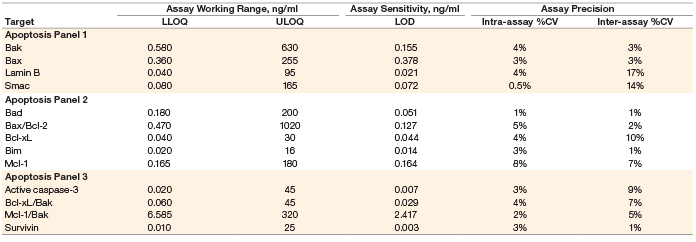
Note: Data were generated using the magnetic workflow with the Bio-Plex Pro II wash station.
Precision was calculated by testing a control lysate in triplicate over five independent runs. These runs were performed over a minimum of 3 days, with at least three different operators. The average of all %CVs of the calculated concentrations of the five runs was reported for intra-assay precision. The %CVs of all the calculated concentrations of the five runs was used to derive inter-assay precision. The precision profile is summarized in Table 3. All assays showed <20% CV.
The assays also demonstrated superior sensitivity over a range of protein loading concentrations relative to a standard western blotting technique (Figure 2).
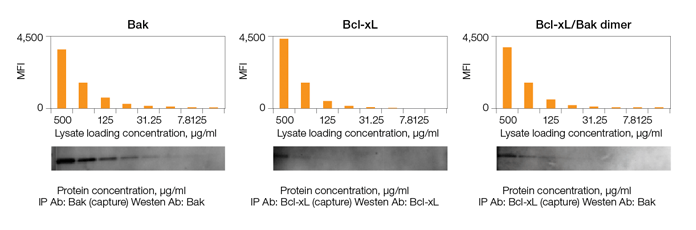
Fig. 2. Sensitivity of Bio-Plex Pro RBM apoptosis assay and immunoprecipitation (IP) western blotting. A lysate purified from the N + M fraction of an untreated prostate cancer PC3 xenograft cell line was serially diluted and then measured using the Bio-Plex Pro RBM apoptosis kit and western blotting methods. MFI, median fluorescence intensity.
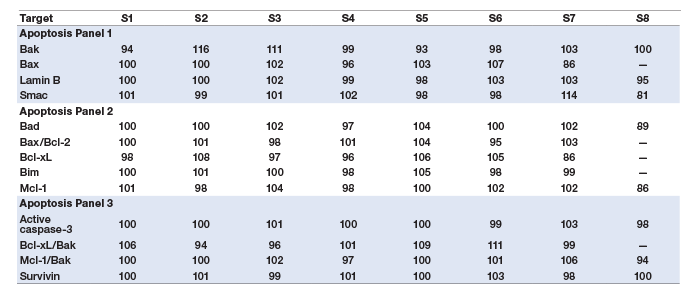
Assay accuracy (also defined as recovery) was calculated as the percentage of the observed concentration value of a spiked standard of known concentration relative to the expected value. Overall, these assays recovered within 80–120% on at least seven of the eight standard points (Table 4).
Table 4. Assay accuracy (standard recovery).
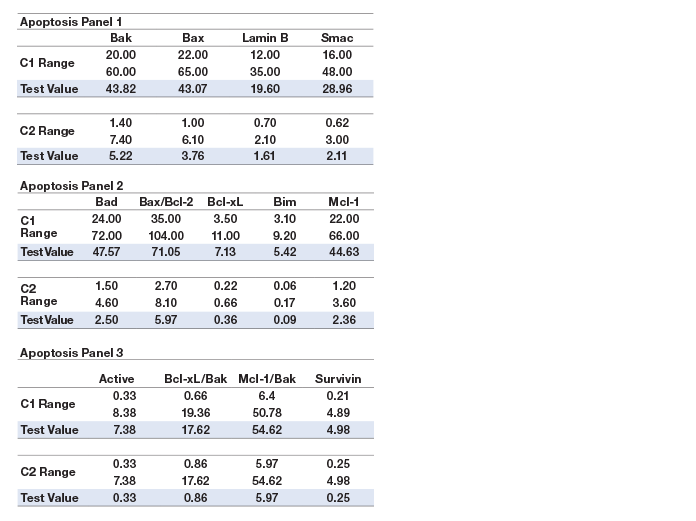
The accuracy of the assays was also assessed by the performance of a two-level cell lysate control (Table 5).
Table 5. Cell lysate controls (ng/ml).
Linearity of dilution ensures that analytes present in concentrations above the LLOQ can be diluted and measured accurately within the assay working range. In this study, lysate samples were serially diluted in lysate dilution buffer to obtain five protein loading concentrations. The observed analyte concentrations were plotted against the loading concentrations to derive a correlation coefficient (R2). The study was conducted in cultured cells and tissue lysate samples. Representative plots are shown in Figure 3.
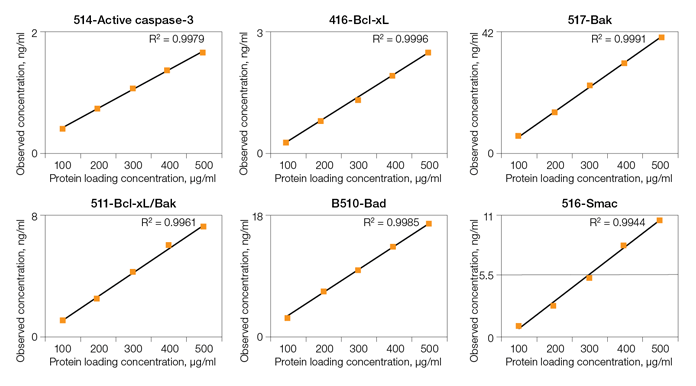
Fig. 3. Linearity of dilution. Lysate samples serially diluted to obtain five protein loadings (100–500 μg/ml). The observed analyte concentrations (representing 30 μl per assay well) were plotted against each protein loading, and the correlation coefficient (R2) values reflect linearity in signal response. Lysate type: 514 (A375-ATCC CRL-1619-cytosolic fraction); 416 (human tumor–total lysate); 516 (PC-3-ATCC CRL-1435-cytosolic fraction); 517 (PC-3-ATCC CRL-1435-N + M fraction); 510 (HCT-116-ATCCCCL-247-cytosolic fraction); 511 (HCT-116-ATCC CCL-247-N + M fraction).
Parallelism was investigated by comparing the slope of a sample curve (spiked tissue lysate, serially diluted in lysate diluent buffer) with a standard curve prepared in standard curve diluent. The results demonstrate that the sample matrix is biologically comparable to the matrix of the standard curve (Figure 4).
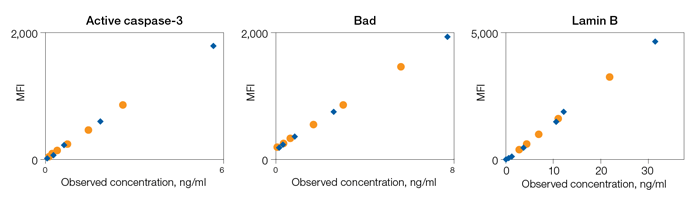
Fig. 4. Assay parallelism. Standard curve (♦) and serial dilution of a HCT116 cell lysate spiked with recombinant antigens (●). MFI, median fluorescence intensity.
Validation with Biological Samples
The apoptosis assays were validated primarily with total lysate extracts prepared from cultured cells and tissues. The assays were also validated using cytosolic and nuclear fractions prepared with proprietary cytosolic and lysis extraction buffers provided in the kits. Representative sample data are shown in Figures 5 and 6.
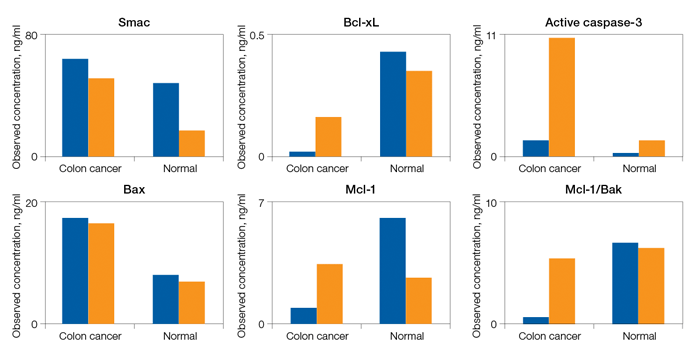
Fig. 5. Detection of apoptosis biomarkers in colon cancer tissue. A representative tissue was processed to compare the levels of apoptosis biomarkers in two sample fractions (N + M and cytosolic) relative to a nonmatching normal colon tissue. The expression levels of Smac, Bax, Bcl-xL, Mcl-1, Active caspase-3, and Mcl-1/Bak are shown as an example. N + M (■); cytosol (■).
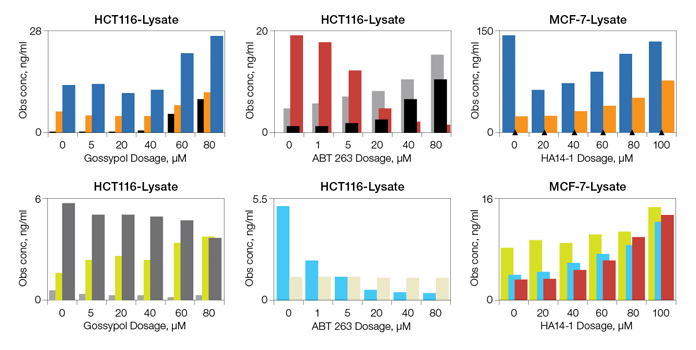
Fig. 6. Drug-induced apoptosis. HCT-116 (ATCC CCL-247) and MCF7 (ATCC HTB-22) cells were treated for 3 hr with increasing concentrations of gossypol (0, 5, 20, 40, 60, and 80 μM), ABT-263 (0, 1, 5, 20, 40, and 80 μM), and HA14-1 (0, 20, 40, 60, 80, and 100 μM). Whole cell lysates were analyzed with the multiplex assays. Active caspase-3 (■); Bak (■); Lamin B (■); Survivin (■); Bax (■); Bax/Bcl-2 (■); Bcl-xL (■); Bcl-xL/Bak (■); Bim (■). Obs conc, observed concentration.
Instrument alignment — Bio-Plex 200, Bio-Plex MAGPIX, and Bio-Plex 3D Systems
The assays were evaluated on Bio-Plex 200, Bio-Plex MAGPIX, and Bio-Plex 3D systems. Excellent agreement in sample readout was recorded on all three platforms (Figure 7).
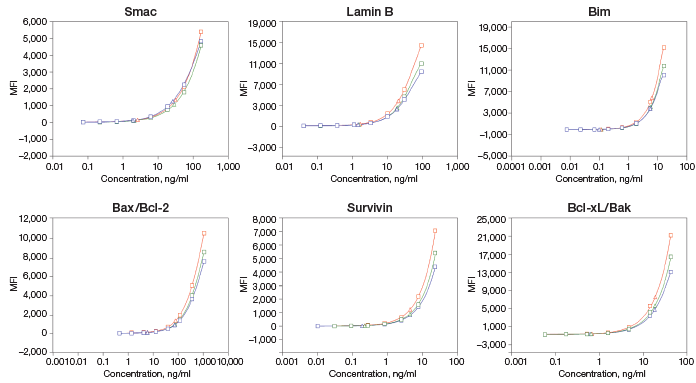
Fig. 7. Platform comparison on standard curve (squares) and 2-level controls (triangles). Bio-Plex MAGPIX (—), Bio-Plex 3D (—), and Bio-Plex 200 (—) systems respectively. MFI, median fluorescence intensity.
Conclusions
In this study, we have shown that apoptosis biomarkers from total cell lysates, nuclear + mitochondrial (N + M) fractions, or cytosolic fractions can be quantified using the Bio-Plex Pro RBM apoptosis assays. These multiplex assays show robust performance in various sample types, and each panel has been optimized for high precision and lot-to-lot reproducibility of sample measurement, guided by a 2-level quality control. The ability to work with limited sample volume and the capacity to multiplex provide an effective option over traditional methods such as western blotting and ELISA for analysis of key apoptosis markers. The assays are ideal for examining the changes of cell death markers in cultured cells and tissues in response to drug exposure. Overall, the assay panels are a useful tool for lead identification and optimization, as well as preclinical and clinical proof of concept.
References
Dewson G and Kluck RM (2010). Bcl-2 family-regulated apoptosis in health and disease. Cell Health Cytoskelet 2, 9–21.
Kuwana T and Newmeyer DD (2003). Bcl-2 proteins and the role of mitochondria in apoptosis. Curr Opin Cell Biol 15, 1–9.
Lindsay J et al. (2011). Bcl-2 proteins and mitochondria-specificity in membrane targeting for death. Biochimica et Biophysica Acta 1813, 532–539.
Rutledge SE et al. (2002). A view to a kill: ligands for Bcl-2 family proteins. Curr Opin Chem Biol 6, 479–485.
Legal Notices
![]()
Manufactured by Myriad RBM®
Myriad RBM is a trademark of Myriad RBM, Inc.
The Bio-Plex suspension array system includes fluorescently labeled microspheres and instrumentation licensed to Bio-Rad Laboratories, Inc. by the Luminex Corporation.
xMAP and Luminex are trademarks of the Luminex Corporation.