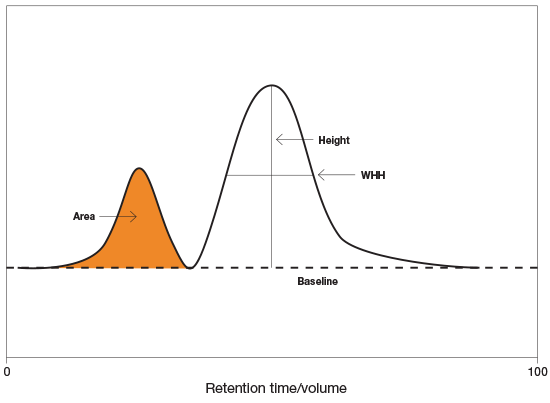
Understanding the peaks is the key to a successful chromatography experiment.

Here are some basic definitions of all the terms related to peaks, what you can determine from the FPLC peaks, and what the peaks can tell you about the quality of column packing, the efficiency of separation, and the purity of the separated proteins.

Peak area
The area under the curve of the UV trace to its baseline. This is often correlated with the amount of protein.
Peak retention time


The time it takes for a peak to come off your column. This can be measured from the start of your run to the apex of your peak of interest. However, the most common method is to measure from the injection of the sample to the apex of the peak.
Retention volume


The volume of liquid needed to pass through your column to elute the peak from your column. The most common method is to measure the volume from the injection of the sample to the apex of the peak. You may also measure the volume from the start of the run to the apex of the peak.
Peak height
The distance from the bottom or baseline of the peak to its apex. The bottom of the peak is defined by either a zero absorbance value or a calculated baseline for increased accuracy.
Relative area
The percentage of the entire calculated peak area represented by a single peak area. This is used to determine yield, purity, or level of contaminants.
Injection point


The time at which the sample is injected onto the column. For example, when using a sample loop, this is the point at which the loop is placed inline. This is often used as the zero time point for measuring peak retention time.
Delay volume

The added volume of liquid present due to the length of tubing between the detector and the head of the fraction collector. This value is important because it is used to ensure that the fraction marks line up properly relative to the peaks.
Peak resolution
Although there are some mathematical definitions for this in chromatography, it is the relative distance between the apexes of two neighboring peaks.
Width at half height (WHH)
A measure of the separation efficiency. The lower the value, the thinner the peak and, therefore, the more efficient the column. In general, columns with smaller beads will have lower values for WHH. It is equal to the distance between the peak boundaries at half the peak height.

Anatomy of the peak

anatomy-of-the-peak

Peak asymmetry


The asymmetry factor (AS), defined as the distance from the center line of the peak to the back slope divided by the distance from the center line of the peak to the front slope.

In general, the AS is a measure of the quality of column packing. Well-packed columns will have an AS of close to 1. All measurements are made at 10% of the maximum peak height.

Purity (using peak area)


Sample purity can be estimated directly from the chromatogram by comparing the peak areas for the peak of interest vs. all other peaks in the chromatogram. This is usually expressed as the percentage of the total peak area represented by the peak area of interest. This also assumes that the peak of interest is pure and contains all of the target protein.

Purity measured by peak area will only take into account purity levels against proteins that absorb at the wavelength used for detection.

Shoulder


Peaks exhibit shoulders when proteins elute from the column at or near the same time, hence the smaller peak partially merges with the larger one and becomes a “shoulder”. Methods should be written and optimized to minimize the amount of shouldering for proteins of interest to ensure maximum purity of the peak.
Previous post

How to Design Hydrolysis Probes for qPCR

Next post

List of Mouse Lineage Biomarkers for Different Immune Cell Types