Despite the pivotal role of the 488 nm (blue) laser in the rise in popularity of flow cytometry, it experienced somewhat of a fall from grace following the shift to higher usage of the 561 nm (yellow) laser, rendering it underutilized in recent years. However, with the advancement of flow cytometry leading to the use of more complex multicolor panels and ever-increasing fluorophore numbers per experiment, the blue laser is starting to make a comeback. Discover how StarBright Blue Dyes can help you make the most out of your 488 nm laser.
In contrast to the vast amount of data that can be generated by a flow cytometer today, their origins stem from the desire to simply count cells or particles with increased accuracy and speed over traditional methods. Eventually, this technology was adapted to include lasers.
In 1970, an instrument called the Cytograph was the first commercial cytometer to have a laser incorporated, with a helium-neon laser system at 633 nm. This machine was able to distinguish live from dead cells based on uptake of trypan blue (Mandal, 2023). Shortly after, this was expanded on to become the Cytofluorograph, equipped with a 488 nm argon laser (Picot et al. 2012).
The introduction of lasers into these cell analyzers, alongside the parallel development of monoclonal antibodies by Kohler and Milstein in the 1970s, enabled the utilization of fluorescently-labeled antibodies targeting markers on the surface of cells for identification of specific cell populations (Leavy 2016). Since then, the rapid evolution of flow cytometers and the increase in available detection reagents has culminated in a boom in popularity and significance of this application, with the flow cytometry market valued at $4.8 billion in 2021 and predicted to rise to $7.6 billion by 2027. Flow cytometry allows the rapid multiparameter analysis of single cells and is used in multiple fields, such as immunology, cancer biology, virology, and disease monitoring and diagnosis (McKinnon 2019).
The Heyday of the 488 nm Laser
The incorporation of the 488 nm laser into cytometers broadened the range of parameters able to be measured at once. Fluorescein isothiocyanate (FITC), a derivative of the low molecular weight dye fluorescein, was first used to label an antibody in 1942. FITC is excitable by the 488 nm laser and emits at 519 nm, a green emission (Coons et al. 1942). Another popular dye that could be excited by the 488 nm laser was rhodamine, which has a red-shifted emission spectrum. By utilizing these two dyes and only one laser, researchers were able to measure forward scatter — a parameter still used today to give an indication of the relative size of a cell — as well as green and red fluorescence (Picot et al. 2012).
By the late 1980s, the majority of flow cytometers came with a built-in 488 nm laser and the demand for new 488 nm excitable dyes was growing. The initial conjugation of phycoerythrin (PE) to antibodies in 1982 provided another option for detection (Oi et al. 1982). PE is a red protein-pigment that plays a major role in light harvesting for photosynthesis in red algae. Different variations of PE exist depending on which species it originates from, namely R-PE, B-PE, and C-PE which are isolated from Rhodophytes, Bangiales, and Cyanophyceae, respectively. With a strong emission at 575 nm, PE is an exceptionally bright fluorophore that provided a notable option for the 488 nm laser and is still frequently used in flow cytometry today (Leney et al. 2018).
The Development of Tandem Dyes
PE contributed more to the dye landscape than just one additional dye, due to the subsequent development of PE-tandem dyes. Before the introduction of tandem dyes, the short Stokes shift — the difference between the excitation and emission wavelength — of most fluorescent molecules meant that few dyes could be used per laser while avoiding overlapping spectra.
In 1983, shortly after the creation of PE-conjugated antibodies, researchers covalently linked PE to other fluorophores, initially the red algae–derived allophycocyanin (APC) and the red fluorescent dye Texas Red (Glazer and Stryer, 1983). The resulting tandem dye enabled energy emitted upon excitation of the donor fluorophore to excite the acceptor fluorophore in a process known as Förster resonance energy transfer (FRET). In this way, the blue laser could be used to excite the PE component while producing a red-shifted emission. Members of the cyanine synthetic dye family, cyanine 5 and 7, are often used as acceptors in tandem dyes, such as PE-Cy5 and PE-Cy7 (Mitra-Kaushik et al. 2021).
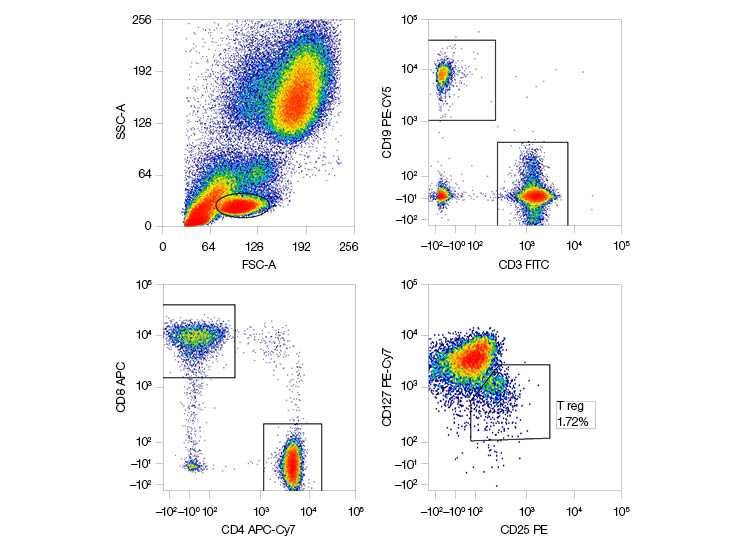
Around the time that the first tandem dyes were created, the 488 nm laser was the most prominent line used for flow cytometry, although other laser lines could also be utilized. However, these early cytometers commonly employed water-cooled argon lasers, which were large in size, expensive, and required heavy maintenance, making it difficult to have more than one laser line in an instrument. Fortunately, in the late 1980s, laser diodes were invented, which were smaller, air-cooled, and cheaper than argon lasers, expediting the development of multilaser flow cytometry systems. This led to red laser diodes regularly becoming the second laser source alongside the blue laser and, due to the development of APC tandems such as APC-Cy7 and APC-Cy5.5, the further expansion of viable panel sizes (Figure 1) (Telford 2015).
| Marker | Fluorescent Dye | Laser | Filter |
| CD3 | FITC | 488 nm | 525/35 |
| CD25 | PE | 488 nm | 593/52 |
| CD19 | PE-Cy5 | 488 nm | 692/80 |
| CD127 | PE-Cy7 | 488 nm | 750LP |
| CD8 | APC | 640 nm | 670/30 |
| CD4 | APC-Cy7 | 640 nm | 775/50 |
Fig. 1. A six-color flow cytometry panel using 488 nm and 640 nm lasers. APC, allophycocyanin; FITC, fluorescein isothiocyanate; LP, long pass; PE, phycoerythrin.
The Downfall of the 488 nm Laser
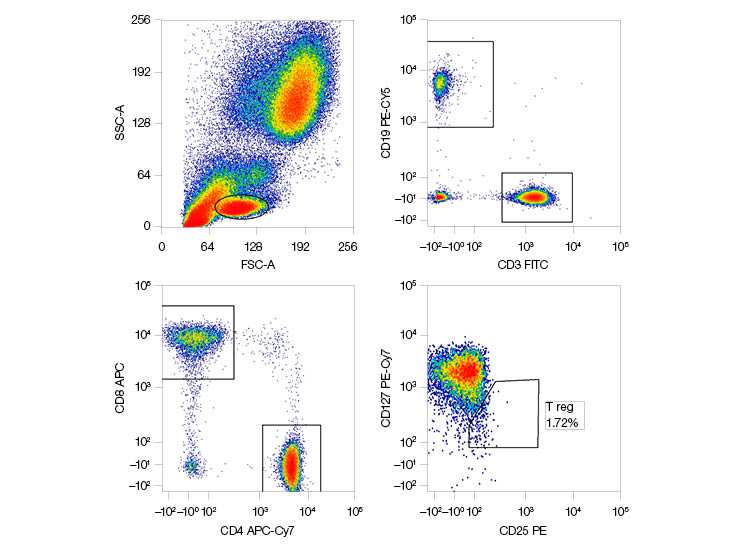
As laser technology developed further, so too did the capabilities of flow cytometers. Eventually, the beginning of the demise of the 488 nm laser came with a paper published by Telford et al. (2005) indicating that the yellow 561 nm laser performed better at exciting PE and PE-tandem dyes than the blue 488 nm laser (Figure 2). Using the 561 nm laser resulted in a brighter signal of PE and PE-tandems, with less autofluorescence and less compensation required than with 488 nm excitable dyes such as FITC (Telford et al. 2005).
The 488 nm laser still proved useful for measuring parameters such as forward and side scatter and detecting fluorescent proteins like green fluorescent protein (GFP); however, there were very few dyes that were optimally excited by this laser, hence its use beyond this was limited.
| Marker | Fluorescent Dye | Laser | Filter |
| CD3 | FITC | 488 nm | 525/35 |
| CD25 | PE | 561 nm | 583/30 |
| CD19 | PE-Cy5 | 561 nm | 670/30 |
| CD127 | PE-Cy7 | 561 nm | 750LP |
| CD8 | APC | 640 nm | 670/30 |
| CD4 | APC-Cy7 | 640 nm | 775/50 |
Fig. 2. A six-color flow cytometry panel using 488 nm, 561 nm, and 640 nm lasers.Resolution of rare populations, such as CD127lo CD25hi T regulatory cells (T regs), is clearer when using the 561 nm laser to excite PE. APC, allophycocyanin; FITC, fluorescein isothiocyanate; LP, long pass; PE, phycoerythrin.
The Comeback of the 488 nm Laser
Cytometer innovation has far from slowed in recent years, with many instruments now available with four or five lasers, such as the ZE5 Cell Analyzer. With the ever-increasing desire to get more information out of each experiment and thereby achieve a more detailed understanding of specific cell subpopulations with various differentiation and activation statuses, the demand for new dye options has expanded rapidly.
In addition, the recent development of spectral flow cytometry has further contributed to this demand. Spectral flow cytometry measures the entire emission spectrum of an excited dye, as opposed to conventional flow cytometry, which filters the emitted light to measure a limited view of the spectrum — typically the peak emission wavelength. Capturing the full spectrum allows the identification of what’s often referred to as the spectral fingerprint, so called for being unique to each dye and subsequently enabling their distinction from others with similar emission peaks. This allows the analysis of even larger and more complex panels, driving the need for more dyes, particularly true 488 nm laser excitable dyes to fill the aforementioned gap in the market (Nolan 2022).
Bio-Rad now offers StarBright Blue (SBB) Dyes to expand your capabilities across the 488 nm laser. The range of six SBB Dyes (SBB580, SBB615, SBB675, SBB700, SBB765, and SBB810) are true 488 nm laser excitable dyes that have been specifically developed for flow cytometry, and while these dyes were developed on the ZE5 Cell Analyzer, they are compatible with any cytometer with the appropriate laser and filter configuration.
StarBright Blue Dyes are ideal for detection of rare populations due to their exceptional brightness, being as bright or brighter than similar competitor dyes, including PE when excited by the 488 nm laser (Figure 3).
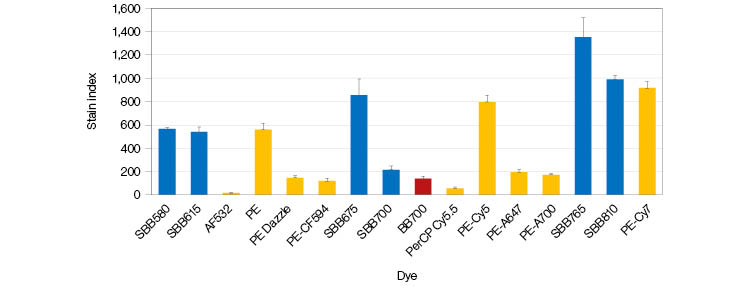
Fig. 3. Stain index comparison of various 488 nm excitable dyes used to detect CD4 in human peripheral blood samples. Whiskers represent standard error. AF, Alexa Fluor; BB, brilliant blue; PE, phycoerythrin; PerCP, peridinin chlorophyll protein; SBB, StarBright Blue.
Additionally, a comparison of a ten-color panel containing PE and PE-tandems excited by the 488 nm laser versus the same panel but with the PE and PE-tandems replaced with StarBright Blue Dyes reveals better separation of positive and negative populations and less spreading with StarBright Blue Dyes (Figure 4).
Taken as a whole, StarBright Blue Dyes seamlessly fill the gap in the market for true 488 nm excitable dyes, with their exceptional brightness, narrow excitation and emission spectra, and their compatibility with existing dyes and instruments, providing you with the tools to get the most out of your flow cytometry experiments.
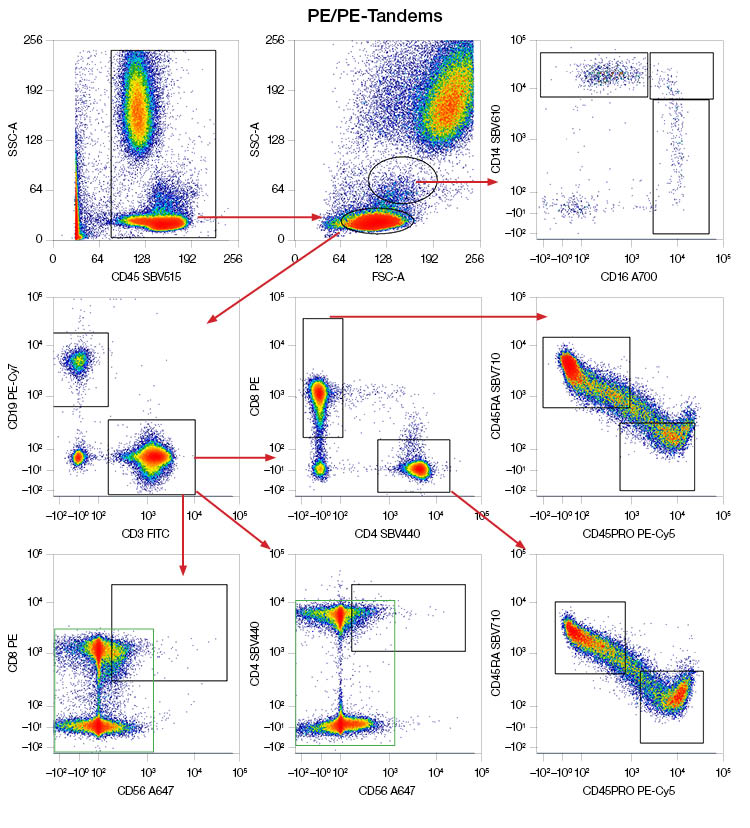
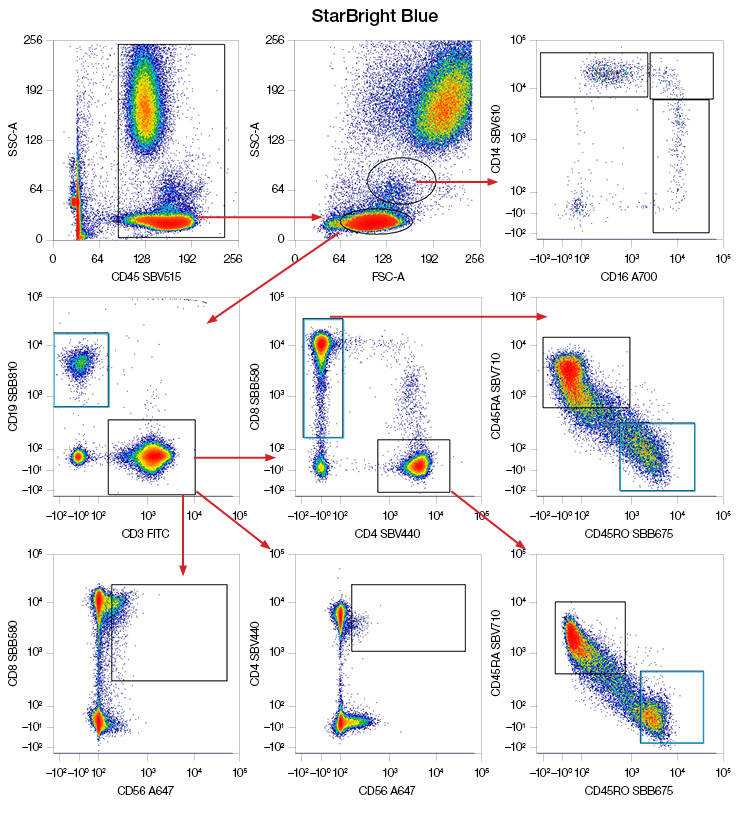
Fig. 4. Performance of PE and PE-tandems excited by the 488 nm laser in a panel compared to StarBright Blue (SBB) Dyes. Human peripheral blood was stained to identify NK cells, B cells, T cells and T cell subsets, and classical, intermediate, and nonclassical monocytes with a panel containing either PE and PE-tandems or SBB Dyes. Blue boxes indicate similar or better separation, green boxes indicate spreading. Data generated on the ZE5 Cell Analyzer. FITC, fluorescein isothiocyanate; PE, phycoerythrin; SBV, StarBright Violet.
References
Coons AH et al. (1942). The demonstration of pneumococcal antigen in tissues by the use of fluorescent antibody. J Immunol 45, 159–170.
Glazer AN and Stryer L (1983). Fluorescent tandem phycobiliprotein conjugates. Emission wavelength shifting by energy transfer. Biophys J 43, 383–386.
Leavy O (2016). The birth of monoclonal antibodies. Nature Immunology 17, S13.
Leney AC et al. (2018). Connecting color with assembly in the fluorescent B-phycoerythrin protein complex. FEBS J 285, 178–187.
Mandal A (2023). Flow cytometry history. https://www.news-medical.net/life-sciences/Flow-Cytometry-History.aspx Accessed April 12, 2024.
McKinnon KM (2019). Flow cytometry: an overview. Curr Protoc Immunol 120, 5.1.1–5.1.11.
Mitra-Kaushik S et al. (2021). The evolution of single-cell analysis and utility in drug development. AAPS J 23, 98.
Nolan JP (2022). The evolution of spectral flow cytometry. Cytometry A 101, 812–817.
Oi VT et al. (1982). Fluorescent phycobiliprotein conjugates for analyses of cells and molecules. J Cell Biol 93, 981–986.
Picot J et al. (2012). Flow cytometry: retrospective, fundamentals and recent instrumentation. Cytotechnology 64, 109–130.
Telford W (2015). Near infrared lasers in flow cytometry. Methods 82, 12–20.
Telford W et al. (2005). DPSS yellow-green 561-nm lasers for improved fluorochrome detection by flow cytometry. Cytometry 68, 36–44.