Introduction
Th17 cells are an important subclass of T-helper lymphocytes that produce IL-17 and other cytokines. Since 2005, the Th17 immune response pathway has been a rapidly expanding field of research, with 83% of literature citations appearing in just the past three years.
Studies in humans and mouse models indicate that Th17 cytokines promote host defense against extracellular microbes such as bacteria and fungi. Recent reports suggest a further role for Th17 cytokines in the protection against protozoa and viruses (O’Quinn et al. 2008 and Hartigan-O’Connor et al. 2011).
The Th17 pathway has also been implicated in the pathogenesis of chronic inflammatory conditions including autoimmune diseases (rheumatoid arthritis, lupus, psoriasis, multiple sclerosis, Crohn’s disease, and type 1 diabetes), allergy, the acceptance or rejection of transplanted organs, and the development and progression of cancer (Wilke et al. 2011).
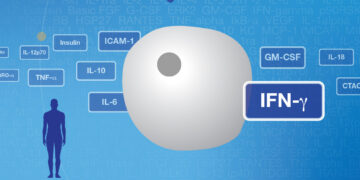
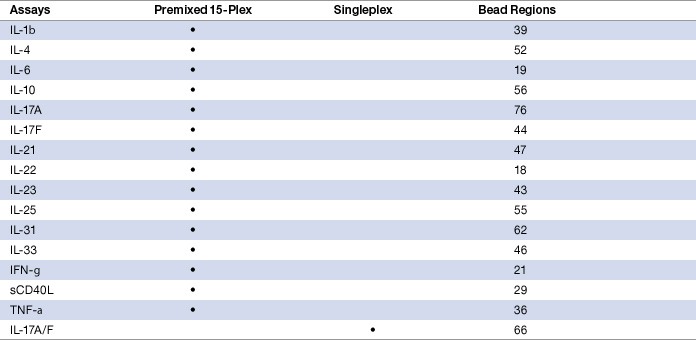
Using Luminex xMAP technology, we have developed a panel of magnetic bead–based assays consisting of sixteen (15+1) markers that are directly relevant to the Th17 immune response pathway (Table 1). The assays are configured to provide the option of testing as a premixed 15-plex panel or as custom blends of selected assays based on specific end-user needs. Magnetic beads are employed to enable automation of wash steps and to ensure compatibility with all Luminex-based life science research instruments.
Table 1. Bio-Plex Pro human Th17 cytokine panel.
The validation studies summarized in this tech note cover all 16 markers in singleplex and multiplex formats. The assays were evaluated in serum, plasma, and cell culture matrices. Testing of patient samples was carried out in collaboration with Pharmasan Labs, Inc.
Method
The Th17 assays were designed on magnetic beads according to a capture sandwich immunoassay format. The capture antibody–coupled beads were first incubated with antigen standards, samples, or controls (60 min) followed by incubation with biotinylated detection antibodies (30 min). After washing away the unbound biotinylated antibodies, the beads were incubated with a reporter streptavidin-phycoerythrin conjugate (SA-PE) for 10 min. Following the removal of excess SA-PE, the beads were passed through the Bio-Plex suspension array reader, which measures the fluorescence of the beads and of the bound SA-PE (Figure 1). All washes were performed using a Bio-Plex Pro wash station. Data acquisition was performed using Bio-Plex Manager™ 6.0 at a low PMT setting. The t-test function in Bio-Plex Data Pro™ software was used to perform statistical analysis on sample data.
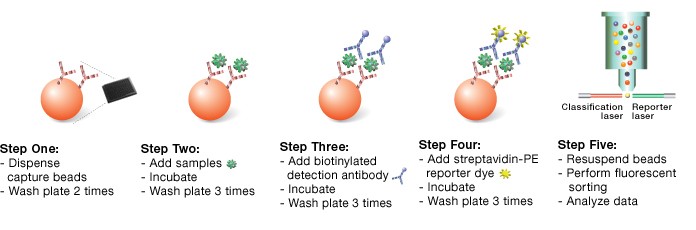
Fig. 1. Schematic representation of a sandwich-based Bio-Plex assay workflow.
Performance Characteristics
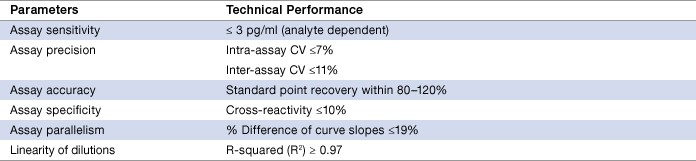
The validation demonstrated excellent performance in terms of sensitivity, precision, accuracy, and robustness in sample measurement (Table 2).
Table 2. Assay performance characteristics.
Assay working range, also known as reportable range, is defined as an interval between the upper limit of quantification (ULOQ) and the lower limit of quantification (LLOQ) in which both intra-assay precision and standard curve accuracy are demonstrated. The Th17 assays are designed to meet an intra-assay precision of ≤10% and a standard curve recovery of 80–120%. With the exception of IL-4 and IL-22, all targets recorded 4 logs in dynamic range (Table 3). This hallmark feature differentiates the Bio-Plex assays from the 2 to 3 logs dynamic range typically recorded on a conventional ELISA standard curve.
Table 3. Assay working range.
To evaluate the precision profile of the assays, intra-assay precision (within-run %CV) was calculated from three replicates at each standard dilution point obtained from a representative assay. Inter-assay precision (between-run %CV) was derived from three independent assays of a series of spiked controls prepared in a serum matrix (Table 4).
Table 4. Intra- and inter-assay precision.
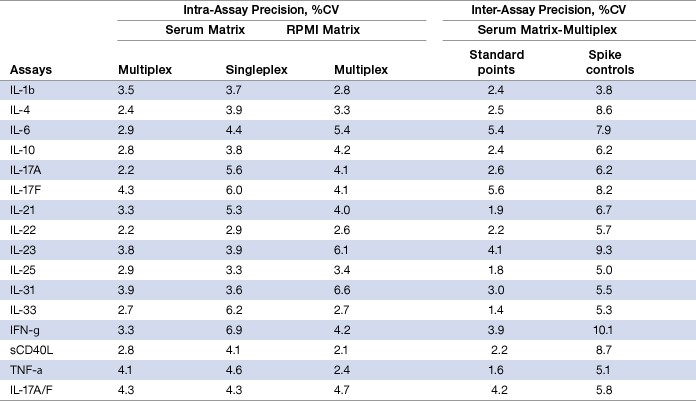
Note: The intra-assay %CV values represent a mean of eight standard points. The inter-assay %CV values for spike controls represent a mean of seven control data points.
Assay accuracy (recovery) was calculated as the percentage of the observed concentration value of a target antigen relative to the expected value. This parameter was investigated in both serum and RPMI cell culture medium by evaluating the recovery of the standard curve plus a series of spike controls prepared in serum matrix. The recovery data showed that in the majority of the assays at least seven of the eight standard points are robust within the specified 80–120% recovery range. This was supported by similar findings on the seven levels of spike controls (Table 5).
Table 5. Standard curve recovery and recovery of spike controls.
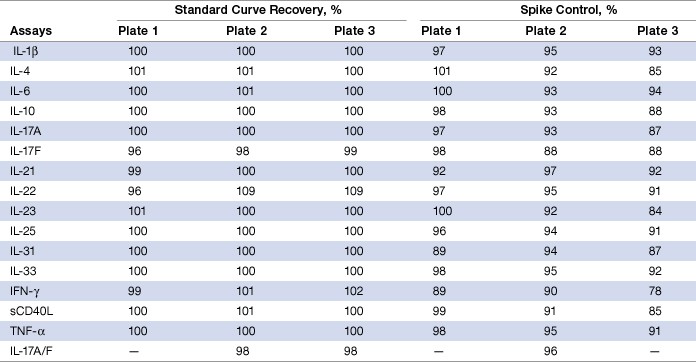
Note: Recovery values represent the mean of eight standard points for the standard curve and the mean of seven points for a series of spike controls.
Assay specificity was examined by subjecting specific test reagents to single-detection cross-reactivity studies. This was conducted by testing the individual detection antibody in the presence of multiplexed antigens and capture beads. Table 6 shows that the degree of cross-reactivity reported among the 15 targets was negligible and that these assays can be easily multiplexed.
Table 6. Single-detection antibody cross-reactivity study.
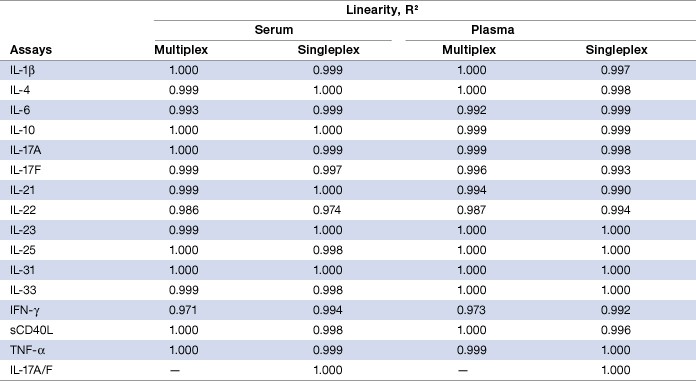
Dilution linearity was investigated in these assays to ensure that analytes present in concentrations above the ULOQ can be diluted and measured accurately within the assay working range. Linearity of dilution was examined by diluting spiked samples with human serum or plasma in a 1:3 serial dilution. Thus, serum or plasma content remains constant throughout the dilution series. The observed and expected sample concentrations within assay working range were plotted for each analyte. The correlation coefficient (R2) value generated by linear regression analysis reflects the linearity of dilution for that assay. In both serum and plasma matrices, the R² values were 0.971 or higher for all the assays. Similar results were obtained with the singleplex assays (Table 7).
Table 7. Linearity of dilution in serum and plasma matrices.
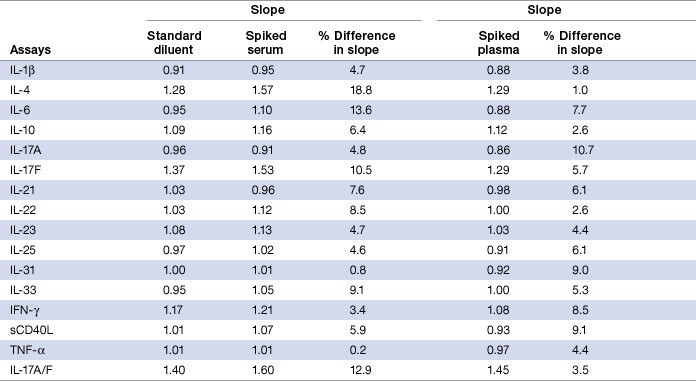
Parallelism analysis was performed in both serum and plasma matrices to ensure that the reference standards and the samples are biologically comparable to each other. This was investigated by comparing the slope values of a spike concentration response curve prepared with either serum or plasma with that of a standard curve prepared in standard diluent. In both sample matrices, all 16 assays demonstrated a parallel dose response between the standard curve and the spiked concentration response curve. Overall, the percentage difference in slope value was < 20% for all the assays (Table 8).
Table 8. Parallelism analysis in serum and plasma matrices.
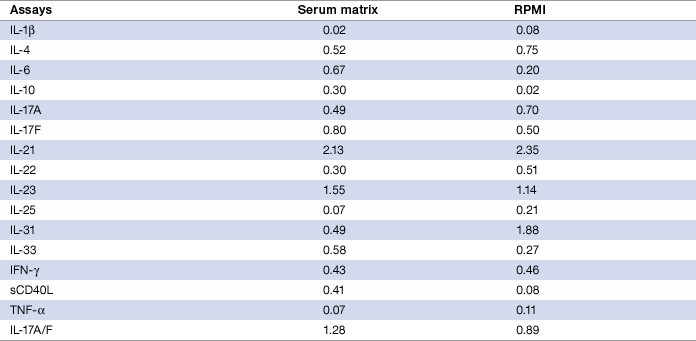
Assay sensitivity, defined as limit of detection (LOD), was evaluated by adding two standard deviations to the mean median fluorescence intensity (MFI) of ten zero standard replicates. In the 16 assays investigated, 13 targets (IL-1β, IL-4, IL-6, IL-10, IL-17A, IL-17F, IL-22, IL-25, IL-31, IL-33, IFN-γ, sCD40L, and TNF-α) recorded ≤1 pg/ml, two targets (IL-23 and IL-17A/F) were at ≤2 pg/ml, and one (IL-21) was at ≤3 pg/ml (Table 9). Overall, the results in the RPMI matrix were comparable to values derived from the serum matrix.
Table 9. Limit of detection (pg/ml) in serum and RPMI matrices.
Validation with Patient Samples
The human Th17 cytokine panel was validated in two separate studies of clinically relevant samples. The first study, performed in collaboration with Pharmasan Labs, Inc., tested the ability to detect native analytes released from peripheral blood mononuclear cells (PBMC). Figure 2 shows the observed concentrations of IL-17A, IL-17F, and IL-23 in culture supernatants after stimulation with various mitogens and antigens. Similar expression patterns were also observed for IL-6, IL-10, IL-31, IL-33, sCD40L, and TNF-a (data not shown). The second study involved collecting measurements in serum and plasma from different disease states.
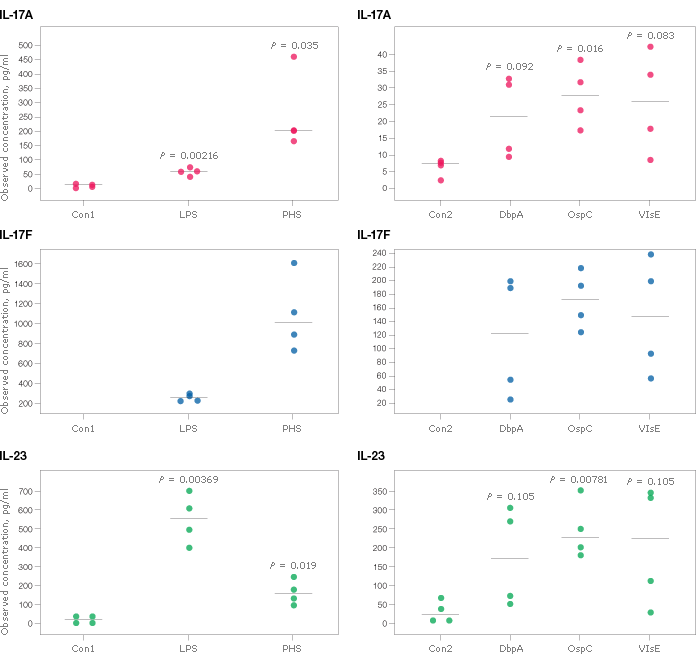
Fig. 2. Cytokine release from stimulated PBMC. Cells (1 x 10⁶/ml) were cultured in the presence or absence of mitogens and antigens at the following final concentrations: phytohemagglutinin (PHA 5 μg/ml), lipopolysaccharide (LPS 5 μg/ml), decorin-binding protein A (DbpA 6 μg/ml), outer surface protein C (OspC 12.5 μg/ml), and variable major protein-like sequence (VlsE-1 12.5 μg/ml) purified from Borrelia burgdorferi. Con1 and Con2 refer to the matching, non-stimulated controls used in each experiment. Bio-Plex Data Pro software was used to calculate statistical differences by t-test. Plots without a p-value indicated that the control levels were undetectable. Sample testing and raw data provided by Pharmasan Labs, Inc.
Figure 3 depicts the levels of IL-6, IL-10, IL-33, and sCD40L in sera from patients diagnosed as normal or as having one of several autoimmune conditions.
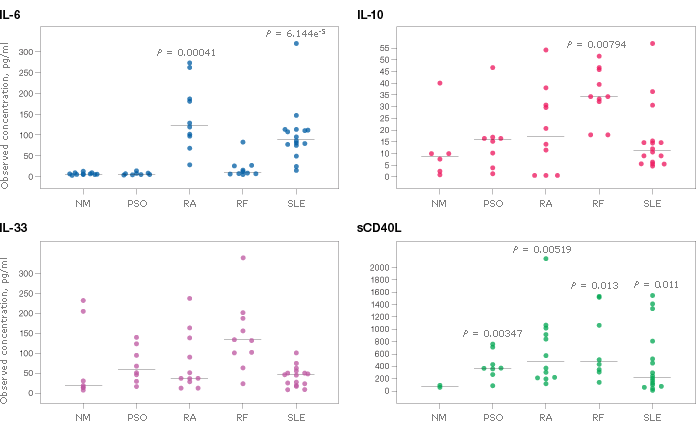
Fig. 3. Serum cytokine levels from individuals with psoriasis (PSO, N = 8), rheumatoid arthritis (RA, N = 14), rheumatoid factors (RF, N = 10), and systemic lupus erythematosus (SLE, N = 18). Non-matching normal (NM, N = 11) serum samples were used as the baseline reference. Bio-Plex Data Pro software was used to calculate statistical differences by t-test. Only p-values with statistical significance are shown.
Conclusions
The newly configured Bio-Plex Pro human Th17 cytokine assays were designed on magnetic beads to provide rapid, robust, and economical collection of multiplex data. All 16 assays validated in this study showed excellent precision, accuracy, specificity, and sensitivity. By measuring multiple analytes simultaneously, the Th17 panel helps to reduce assay time, cost, and sample volume compared to more traditional methods such as ELISA. This high-throughput multiplex approach is rapidly becoming a standard in basic research and clinical laboratories.
References
Hartigan-O’Connor DJ et al. (2011). Th17 cells and regulatory T cells in elite control over HIV and SIV. Curr Opin HIV AIDS 3, 221–227.
O’Quinn DB et al. (2008). Chapter 5 Emergence of the Th17 pathway and its role in host defense. Adv Immunol 99, 115–163.
Wilke CM et al. (2011). Deciphering the role of Th17 cells in human disease. Trends Immunol 32, 603–611.
xMAP is a trademark of the Luminex Corporation.
The Bio-Plex suspension array system includes fluorescently labeled microspheres and instrumentation licensed to Bio-Rad Laboratories, Inc. by the Luminex Corporation.