This third part of our four-part cell health series focuses on autophagy. We briefly review the three main autophagy pathways and discuss common methods for monitoring these processes.
Autophagy
Autophagy is a highly conserved process in which cytoplasmic components and organelles are degraded by the lysosome. This process allows cells to clear their cytoplasm of dysfunctional organelles and intracellular pathogens as well as to recycle cytoplasmic components. Though autophagy was originally identified as a response to starvation, it is now clear that many other stressors can trigger the process and that basal levels of autophagy are key to cellular homeostasis. Autophagy is upregulated by a wide range of stimuli, including hormonal stimulation innate immune signals, and physiological stresses such as energy depletion or high temperature. Downregulation of autophagy, on the other hand, is associated with a range of diseases including cancers, infectious diseases, and neurodegenerative disorders and has been linked to aging.
There are three main autophagy pathways (Figure 1).
Microautophagy delivers its targets to the lysosome via invagination of the lysosome membrane, allowing degradation of small volumes of cytoplasmic content. This process is poorly understood but is thought to involve proteins like the dynamin-related GTPase Vps1p responsible for invagination and a number of autophagy-related gene (Atg) proteins.
Chaperone-mediated autophagy (CMA) delivers cytoplasmic proteins to the lysosome through direct translocation across the lysosome membrane. A KFERQ-like pentapeptide motif targets proteins to the lysosome via interaction with cytosolic Hsc70 and its cochaperones. The substrate-Hsc70 complex interacts with the CMA receptor Lamp-2A at the lysosome membrane, resulting in Lamp-2A multimerization to form the translocation complex. The substrate is then unfolded and translocated across the lysosome membrane with the help of luminal Hsc70 (lys-Hsc70).
Macroautophagy, the most studied autophagy pathway, allows degradation of larger amount s of cytoplasmic content and is mediated by a specialized organelle, the autophagosome. Macroautophagy begins with formation of a phagophore assembly site (PAS) and assembly of the Unc51-like kinase (Ulk) complex to initiate autophagosome formation (Figure 1). This is followed by the nucleation stage, when the Ulk complex interacts with a class III PI3K complex composed of beclin-1, Vps15, Vps34, and Atg14 to form the phagophore. Nucleation is followed by expansion of the phagophore membrane to form the autophagosome. During this stage Atg12/5/16 complex recruitment facilitates conjugation of phosphatidylethanolamine (PE) to LC3 (Atg8 in yeast), the only known marker of autophagosome membranes. PE-LC3 is required for several key steps of autophagy: autophagic membrane expansion, recognition of autophagic cargoes, and autolysosome formation. This entire process is orchestrated by more than 30 autophagy-related genes (Atg proteins), including Beclin-1, lysosome-associated membrane proteins (Lamp-1 and Lamp-2), and microtubule-associated proteins 1A/1B light chains 3A/B (MAP1LC3A/B or LC3), which are common markers for autophagy. In the final step of macroautophagy, the fully formed autophagosome fuses with a lysosome to deliver its cargo for degradation.
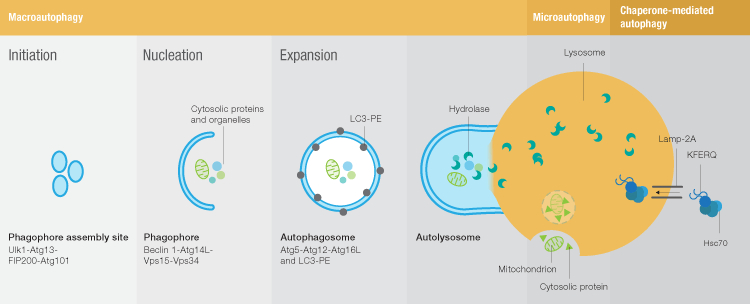
Fig. 1. Autophagy pathways.
Assessing Autophagy
Microautophagy is poorly understood and consequently the number of tools available to study this process is limited. The most commonly used method for assessing microautophagy is electron microscopy to look for the vesicles formed during lysosome membrane invagination.
Chaperone-mediated autophagy (CMA) is much better understood. Three chaperones found in the lysosome membrane and lumen (lys-Hsc70, membrane-associated Hsc70, and lys-Hsp90) seem to be dedicated to CMA. Levels of Lamp-2A, a membrane protein thought to be the receptor for CMA substrates, can be used to assess CMA activity, and co-localization of Lamp-2A and Hsc70 can be used to identify CMA-active lysosomes. In addition, several criteria have been set to define CMA substrates:
- presence of a KFERQ-like targeting motif;
- association with lys-Hsc70–positive lysosomes;
- degradation rates that depend on lysosomal activity;
- interaction with cytosolic Hsc70;
- interaction with the cytosolic domain of Lamp-2A;
- concentration dependent on Lamp-2A activity;
- ability to translocate into purified lysosomes.
The remainder of this article will focus on methods to assess macroautophagy. When assessing macroautophagy the use of markers for more than one of the stages of autophagy is recommended. An increase in the number of autophagosomes, for example, could be the result of an upregulation of autophagy or of a block in later steps of autophagy. It is therefore wise to include controls in that can speak to these differences.
1. Electron microscopy
Transmission electron microscopy (TEM) remains a very popular and widely used method for detecting autophagy. Structures formed during autophagy, such as the phagophore and autophagosome can be identified using electron microscopy. TEM is able to qualitatively distinguish early stages of autophagy through the presence of autophagosomes containing intact cytosol or organelles from late stages of autophagy, which are characterized by autolysosomes with partially degraded cytosol and organelles. This method, however, requires an experienced user who can reproducibly identify and define these ultrastructural features. It should also be noted that it is very difficult to make objective quantitative measurements using TEM.
2. LC3/Atg8 and p62/SQSTM1
Microtubule-associated proteins 1A/1B light chains 3A/LC3A and 3B/LC3B (MAP1LC3A/B), commonly abbreviated to LC3 or called Atg8 in yeast, are the most reliable markers for autophagosomes.
LC3 exists as an inactive cytosolic form (LC3-I) that is converted into the active autophagosome membrane-bound LC3-II via proteolysis and lipidation during autophagy. This can be monitored by Western blot, as an appearance of the smaller LC3-II band (Figure 2A), or by immunofluorescence or immunohistochemistry, as a relocalization of LC3 from the cytoplasm to membrane structures (Figure 2B). When performing these assays, it should be kept in mind that LC3-II is degraded upon fusion of the autophagosome with the lysosome. In some cases, high autophagic flux can result in low levels of LC3-II even though autophagic activity is high.
With proper controls LC3-II puncta can be counted to quantify the number of autophagosomes. This can be done either manually or, ideally, using image analysis software, as these computer programs are less likely to introduce bias. Because autophagy occurs at a basal level in all cells, changes in the number of LC3-II puncta rather than number of cells with LC3-II puncta should be used as a measure of autophagy regulation.
LC3 antibodies and GFP-LC3 fusions are also frequently used to assess autophagy by flow cytometry. Although autophagy results in an increased concentration of LC3-II, it results in an overall decrease in total LC3 concentration, which can be quantified by flow cytometry.
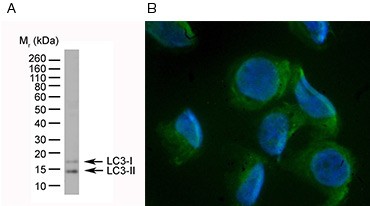
Fig. 2. Identification of autophagy by western blotting and fluorescence microscopy. Conversion of LC3-I to LC3-II can be monitored by western blot (A) and fluorescence microscopy (B).
An important consideration when using LC3 as an indicator of autophagosome formation is that changes in LC3-II levels are tissue- and cell type–specific and not all autophagy-related proteins will prevent LC3 processing when deleted. When using western blotting to quantify LC3-I processing, proper controls need to be incorporated, including standardization controls, because some anti-LC3 antibodies show differential sensitivity for LC3-I and LC3-II. LC3-I is also more sensitive to freeze thaw and degradation even in SDS sample buffer. Samples should therefore be boiled immediately and not subjected to multiple freeze-thaw cycles.
p62 degradation is another commonly used marker as this protein is preferentially degraded via autophagy during autophagic clearance of polyubiquitinated proteins. It should be noted that both LC3 and p62 can be transcriptionally regulated during autophagy. It is thus advisable to complement LC3 and p62 degradation assays with other measures of autophagy.
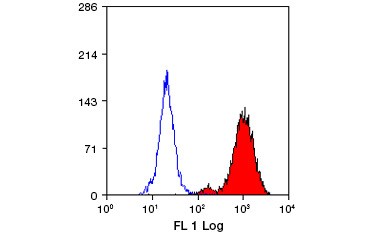
Fig. 3. Identification of Lamp-2–positive cells by flow cytometry. Mouse peritoneal macrophages stained with FITC-labeled rat anti-mouse Lamp-2 antibody following permeabilization with Leucoperm™ Accessory Reagent. The Lamp-2 positive cell population is highlighted in red.
3. Lamps, Atg5, Atg14, and Beclin-1
Antibodies against lysosome markers Lamp-1 and Lamp-2, or against phagophore and autophagosome markers such as Atg5, Atg14, and Beclin-1, are commonly used to track progression of autophagy via immunofluorescence microscopy, western blotting, and flow cytometry. Lysosome markers like Lamp-2 (Figure 3) should be used in conjunction with other autophagy markers, such as LC3-II, to assess autophagy. Atg14 also associates with the ER, so it too should be used only in conjunction with other autophagy markers. Beclin-1 puncta can be used as markers for autophagy induction but are not present in Beclin-1 independent autophagy.
4. Cathepsin activity

Fig. 4. Identification of lysosomes by fluorescence microcopy. Intracellular cathepsin K activity is detected in THP-1 cells using Magic Red Cathepsin K Kit.
Fluorophore-conjugated cathepsin substrates can be used to identify lysosomes in living cells by reporting the presence of cathepsin B, K, and L protease activity. These cell-permeable, nontoxic reagents are added to cells and cleaved in the presence of cathepsin to yield a fluorescent product (Figure 4). When combined with nuclear dyes such as Hoechst and lysosome and organelle markers such as acridine orange, the level of autophagy can be assessed. These assays are compatible with fluorescence microscopy as well as readout using a microplate reader and can be used in conjunction with markers for the autophagosome to track autophagosome to autolysosome maturation.
5. Assessing autophagic flux
Because autophagy is a dynamic process it is wise to assess autophagic flux rather than quantify autophagosome numbers alone. Autophagic flux can be measured using a variety of assays. LC3-II turnover can be estimated by western blot by comparing LC3-II generation and turnover under different conditions or in different samples.
Autophagosome to autolysosome maturation can be quantified by taking advantage of the fact that GFP, but not RFP, is quenched in the acidic lysosome environment. Using RFP-GFP-LC3 fusions, autophagosomes appear yellow whereas autolysosomes appear red due to quenching of GFP fluorescence. Various vendors also offer tracer dyes and fluorogenic protease substrates that allow selective labeling of autophagosomes.
Finally, a highly quantitative way to measure autophagic flux is through isotopic labeling of long-lived proteins. This allows tracking of autophagy induction as a function of isotope label release upon protein degradation.
When investigating autophagy it is important to consider that there is significant crosstalk between autophagy and apoptosis; cathepsins and Beclin-1, for example, have also been implicated in mediating apoptosis. It is therefore advisable to use multiple markers when assessing autophagy to avoid erroneous conclusions. Part four of this series will describe this crosstalk in greater detail.
Table 1. Summary of assays for detecting hallmarks of autophagy.
| Autophagy feature | Reagents that allow detection | Application |
| Phagophore | Atg proteins, Beclin-1, electron microscopy | Western blotting, flow cytometry, fluorescence |
| Autophagosome | LC3-II antibodies; GFP-LC3 fusions; electron microscopy | Western blotting, flow cytometry, fluorescence microscopy |
| Autolysosome | Electron microscopy, RFP-GFP-LC3 fusions, cathepsin assays, Lamp-1 and Lamp-2 | Western blotting, flow cytometry, fluorescence microscopy |
| Autophagic flux | RFP-GFP-LC3 fusions; fluorogenic protease substrates; isotopic labeling; p62/SQTSM1 turnover | Western blotting, flow cytometry, fluorescence microscopy, radioisotope detection |
Visit our cell health range page for information about Bio-Rad’s assays for cell viability, proliferation, apoptosis, and autophagy.
Read Part I Assessing Cell Health: Viability and Proliferation Read Part II Assessing Cell Health: ApoptosisFurther Reading
Klionsky DJ et al. (2012). Guidelines for the use and interpretation of assays for monitoring autophagy in higher eukaryotes. Autophagy 8, 445–544.
Li W et al. (2012). Microautophagy: lesser-known self-eating. Cell Mol Life Sci 69, 1125–1136.
Kaushik S et al. (2011). Chaperone-mediated autophagy at a glance. J Cell Sci 124, 495–499.
Barth S et al. (2010) Autophagy: assays and artifacts. J Pathol 221, 117–124.
Mizushima N et al. (2010). Methods in mammalian autophagy research. Cell 140, 313–326.