IT’S HERE! The core lab finally invested in a spectral flow cytometer, and you can now combine your two, 20-color panels into one large panel, potentially reducing instrument time by half. However, to build the optimal panel it is important to consider where to begin and whether existing antibodies remain suitable. In this article we present guidance on how to develop large, reproducible spectral panels.
How Is Spectral Flow Different from Conventional Flow Cytometry?
Spectral cytometers capture complete emission spectra from each fluorophore using multiple detectors, unlike conventional flow cytometry, which separates emissions into distinct channels with detection gaps (Figure 1). This overdetermined system, with more detectors than fluorophores, allows using fluorophores whose emission maxima are closer together than would be comfortable in conventional systems, enabling the use of more colors.
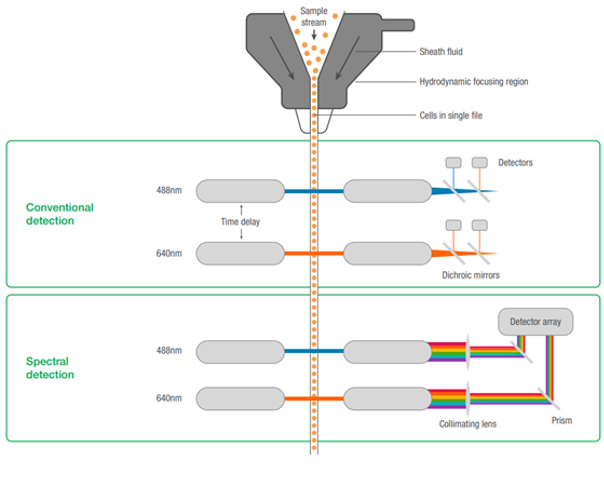
Fig. 1. Comparison of conventional vs. spectral flow cytometry.
Seven Steps to Spectral Success
1
The Usual Rules Apply
Standard panel design principles apply, even with spectral flow allowing more fluorophores.
- Understand your instrument
- Know your fluorophore characteristics and antigen densities to balance brightness against antigen density
- Consider coexpression patterns
- Always titrate reagents (more on this later)
- Use viability dyes
- Optimize sample prep for high-quality data
- Assign low-spread fluorophores to broadly expressed markers (e.g., CD45, CD3) to reduce overall spread
- While similar spectrum dyes can be used, it’s still best to maximize all lasers and detectors and select fluorophores with low similarity scores for robust unmixing
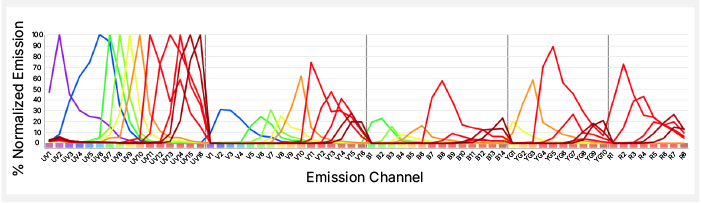
- Just because you can use similar dyes doesn’t mean you should. Utilizing fluorophores with unique emission spectra, such as StarBright™ Dyes, will reduce spread and aid panel expansion (Figure 2).
Further information on panel building is available here and in this on-demand webinar.
A.
B.
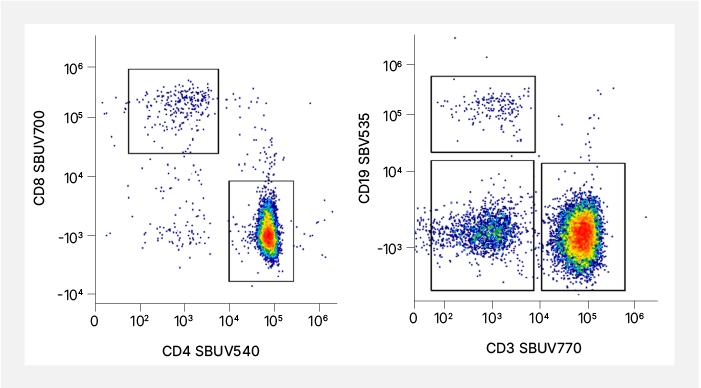
Fig. 2. Dyes with unique spectra. A. Normalized emission spectra of the 11 StarBright UltraViolet Dyes. SBUV445, SBUV540, SBUV700, and SBUV770 have unique peak emissions. B. Representative staining from spectral StarBright Dyes that have unique peak emissions.
2
Match Your Single-Stain Controls to Experimental Conditions for Reliable Panels
Single-color controls are essential for achieving reliable unmixing and should be handled with the same precision as primary samples. Each dye requires a single-stain control that matches the biological sample, staining buffer, and antibody concentration applied during the experiment, as even subtle variations can impact the quality of unmixing in the final panel. Additionally, standardizing both the gating strategy for identifying positive populations and the brightness level is crucial. While single-stained cells provide the best match to cells in the experiment,1 compensation beads may be preferable if the marker is very dim, rare, or highly affected by autofluorescence noise. As the panel size expands, consistent controls become critical, since minor errors can be magnified.
3
Avoid Fluorophores That Overlap with Autofluorescence to Prevent Distorted Signals
Autofluorescence acts as an unseen fluorophore present in all cells that can be unmixed into a separate channel,2-4 provided an unstained control is included. However, since its signals may affect multiple detectors, unmixing autofluorescence can be challenging without proper characterization. To improve extraction, choose fluorophores that avoid overlapping with autofluorescence and do not assign low or variable markers near autofluorescence peaks. For instance, BV510 closely matches the autofluorescence of peripheral blood mononuclear cells on the Cytek Aurora, distorting data when unmixed. Replacing BV510 with StarBright Violet 535, which has a sharper peak and less similarity to autofluorescence, can yield more reliable results (Figure 3).
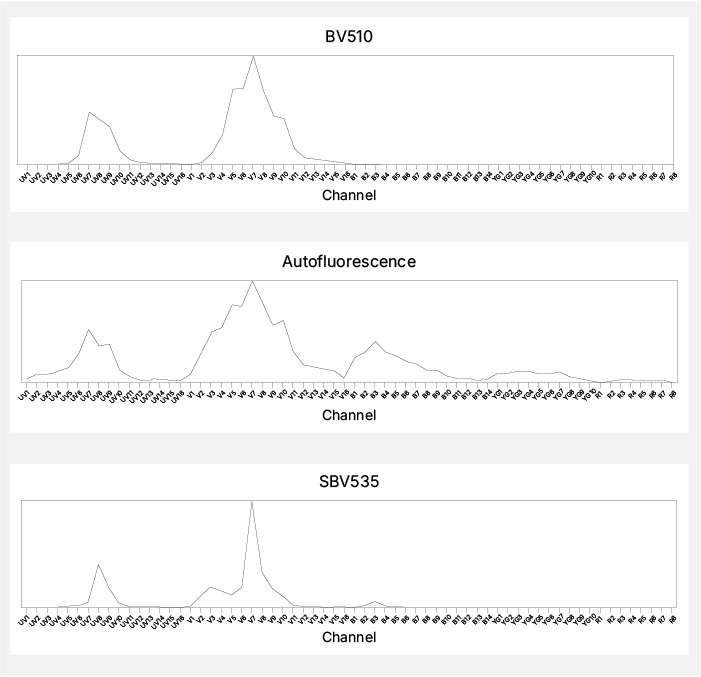
Fig. 3. Autofluorescence. The similarity of the autofluorescence spectral signature to BV510, but not SBV535, can lead to spectral unmixing errors.
4
Titrate Antibodies Within the Full Panel to Preserve Accuracy and Reduce Spread
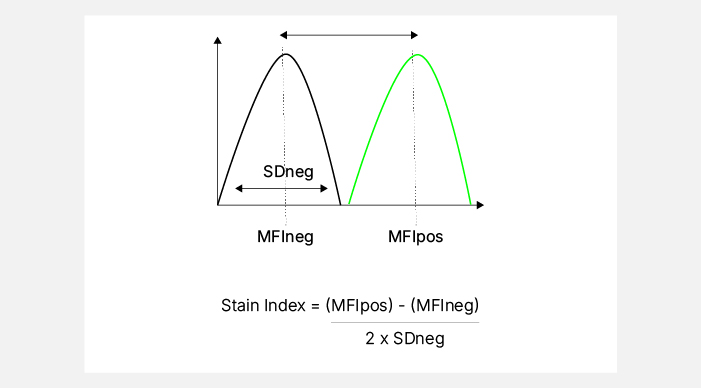
As with conventional flow cytometry, accurate titration is critical for maintaining data quality and panel stability1,5-6. The optimal antibody concentration is determined by balancing separation between positive and negative populations while minimizing background and spread noise, with the stain index being the most popular metric to assess this. 5,7 (Figure 4). Additional considerations for precise titration include utilizing additional markers that help identify low-level or dim markers on expressing cells, such as using CD4 and FoxP3 when selecting the CD25 antibody concentration. Spectral unmixing can impact apparent brightness and variance, so titrations are ideally performed within the context of the full fluorophore matrix rather than in isolation. If spillover spread is a concern, using a lower concentration can reduce both brightness and spread (Figure 4). This approach is most applicable to markers exhibiting bimodal expression8. Additionally, titration points that yield comparable results at both the next higher and lower dilutions may provide greater reproducibility5, supporting stability under varying experimental conditions such as incubation time, temperature, cell number, or activation state, and helping to identify conjugates that may require replacement.
A.
B.
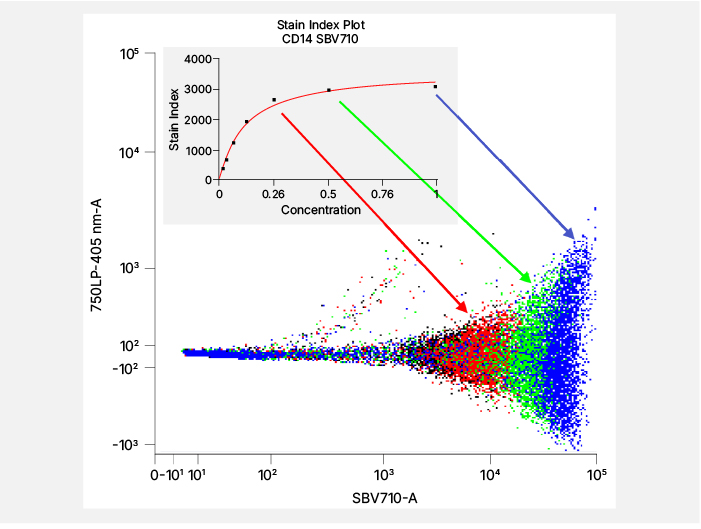
Fig. 4. Titration. A. Stain index calculation. B. Representative staining showing how a lower antibody concentration can reduce the brightness and spread of the positive population.
5
Understand Dye Limitations and Special Requirements
One major source of reproducibility errors is the use of tandem dyes. Tandem fluorophores, composed of a donor-acceptor pair, can undergo degradation or energy transfer shifts over time or in contact with living cells9-11 (Figure 5). These changes alter their emission spectrum and, consequently, their unmixing behavior. While tandem dyes are often necessary, avoid pairing them with markers present on multiple or highly abundant lineages, as breakdown varies by cell type10-12. Interactions among certain dye chemistries, such as the Brilliant Ultraviolet (BUV) and Brilliant Violet (BV) series or the NovaFluor series, can further distort the unmixed data when used in combination13. Specialist staining buffers can help, but switching to non-interacting dyes such as StarBright Dyes or Alexa Fluor derivatives may offer greater stability and reproducibility without extra buffer costs or optimization steps.
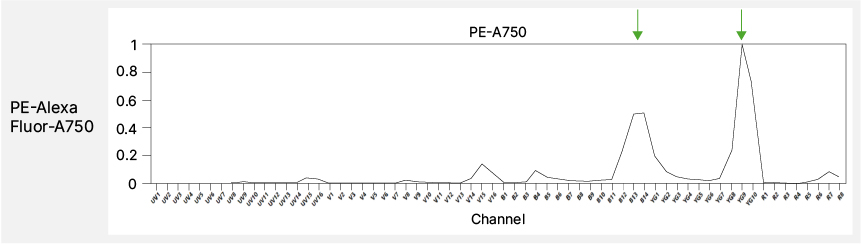
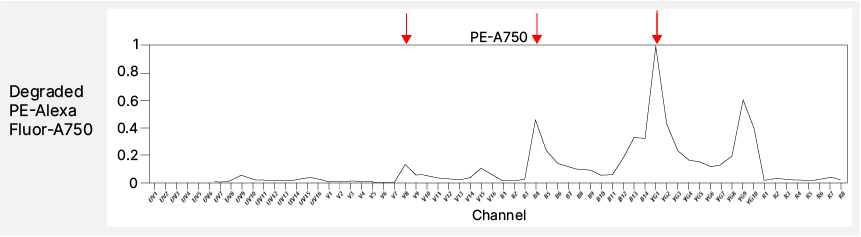
Fig. 5. Tandem breakdown. The top panel shows the complete spectrum of PE-AF750 with the expected emission peaks marked by green arrows. The bottom panel shows the spectra of the degraded tandem dye with corresponding unexpected emission peaks marked by red arrows.
6
Validate Panels on Representative Tissues to Ensure Real-World Performance
For assays focused on tumor or tissue samples, testing and titrating panels on peripheral blood may be ineffective. Panels should be evaluated on representative samples that reflect the expected diversity and activation states. Factors like sample volume, staining time, staining temperature, cell concentration, and operator technique can impact spectral consistency. Systematic testing across experiments or operators improves reproducibility and identifies stable conditions, especially in multi-batch or multi-site studies. A robust panel also supports obtaining consistent results across various spectral instruments.
7
Reduce Costs by Merging Panels and Eliminating Redundant Core Markers
The cumulative expense of purchasing 40+ conjugates for high-parameter assays can limit throughput and replication. Combining panels (e.g., two 20-color panels) can often eliminate redundant core markers like CD3, CD19, or CD14. You may also evaluate each reagent’s share of total costs and prioritize optimizing or substituting the most expensive antibodies. Other cost-saving strategies include replacing expensive conjugates, diluting antibodies for overnight staining14, consolidating purchases, and negotiating vendor discounts, especially for large studies.
Summary
Spectral flow cytometry builds on conventional flow cytometry by using high-dimensional spectral measurements and linear unmixing to distinguish similar fluorophores and account for autofluorescence. However, it requires careful panel design, control selection, and validation. Effective panels are guided not only by brightness and expression levels but rely on thoughtful fluorophore selection, including the inclusion of unique dyes. Integration of autofluorescence modeling is essential, and attention to minimizing spread, titrating appropriately, stress testing, and managing costs are all critical to a successful, reproducible high-dimensional spectral cytometry assay.
A more substantial guide to spectral flow cytometry, written by Oliver Burton, PhD, from the University of Cambridge, UK, with more in-depth information on the topics listed here, can be found in the updated Flow Cytometry Basics Guide from Bio-Rad.
References
- Ferrer-Font L et al. (2021). Panel optimization for high-dimensional immunophenotyping assays using full-spectrum flow cytometry. Curr Protoc 1, e222.
- Jameson VJ et al. (2022). Unlocking autofluorescence in the era of full spectrum analysis: Implications for immunophenotype discovery projects. Cytometry A 101, 922–941.
- Roet JEG et al. (2024). Unbiased method for spectral analysis of cells with great diversity of autofluorescence spectra. Cytometry A 105, 595–606.
- Wanner N et al. (2022). Using the Autofluorescence Finder on the Sony ID7000™ Spectral Cell Analyzer to identify and unmix multiple highly autofluorescent murine lung populations. Front Bioeng Biotechnol 10, 827987.
- Bonilla DL et al. (2024). The power of reagent titration in flow cytometry. Cells 13, 1677.
- Burn OK et al. (2024). Combinatorial antibody titrations for high-parameter flow cytometry. Cytometry A 105, 388–393.
- Maecker HT et al. (2004). Selecting fluorochrome conjugates for maximum sensitivity. Cytometry A 62, 169–173.
- Liechti T et al. (2023). A robust pipeline for high-content, high-throughput immunophenotyping reveals age- and genetics-dependent changes in blood leukocytes. Cell Rep Methods 3, 100619.
- Hulspas R et al. (2009). Flow cytometry and the stability of phycoerythrin-tandem dye conjugates. Cytometry A 75, 966–972.
- LeRoy C et al. (2009). Flow cytometry APC-tandem dyes are degraded through a cell-dependent mechanism. Cytometry A 75, 882–890.
- Morawski PA et al. (2019). Rapid light-dependent degradation of fluorescent dyes in formulated serum-free media. Immunohorizons 3, 585–592.
- Jensen IJ et al. (2020), Worry and FRET: ROS production leads to fluorochrome tandem degradation and impairs interpretation of flow cytometric results. Immunity 52, 419–421.
- Konecny AJ et al. (2024). OMIP-102: 50-color phenotyping of the human immune system with in-depth assessment of T cells and dendritic cells. Cytometry A 105, 430–436.
- Whyte CE et al. (2022). Do more with less: improving high parameter cytometry through overnight staining. Curr Protoc 2, e589.