Appendix: Options for Dataset Export
Three different ways of exporting a dataset are explained in the following.

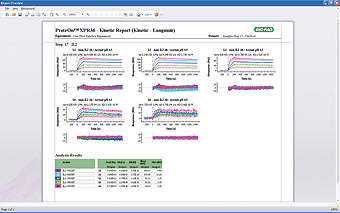
Option 1 – Print a ProteOn Manager Report
- In the Navigator sidebar, click on the Analysis Dataset tab and choose a dataset. When a graph with overlaid fitted curves is preferred, select an analyzed sensorgram set under the dataset. If the “Unsaved processed data will be lost” dialog box appears, select Yes. Choose Print in the submenu.
- In the Report Options dialog box, select the items to be included in the report and then click OK. The experiment report is generated in the Report Preview
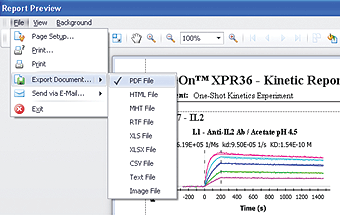
- In the menu bar, select File > Export Document and choose the report format in the submenu. Click OK in the dialog box, select the target folder in which to store the report, and click Save to save the experiment report. screen.
Option 2 – Copy Sensorgrams to a Presentation
- In the Navigator sidebar, enter the Analysis Dataset tab and choose a dataset. When a graph with overlaid fitting curves is preferred, select an analyzed sensorgram set under the dataset.
- Click to select the graph to be copied. Hold down the Ctrl key to select multiple graphs, or press Ctrl+A to select all graphs.
- Right-click any selected graph and choose Copy Graph. A status bar is shown. When the copy process is completed, paste the graph into the presentation.
Option 3 – Export Data to a Spreadsheet
- In the Navigator sidebar, enter the Analysis Dataset tab and choose a dataset. If the curve-fitting data are needed, select an analyzed sensorgram set under the dataset.
- Click to select the graph to be copied. Hold down the Ctrl key to select multiple graphs, or press Ctrl+A to select all graphs.
- Right-click any selected graph and choose Copy Data. A status bar is shown. When the copy process is completed, paste the graph into a spreadsheet. The first column lists time values, and the other columns list the sensorgram response values and the corresponding curve-fitting data