Introduction
Classifying and understanding genetic variation between populations and individuals is an important aim in the field of genomics. Many common diseases (diabetes, cancer, osteoporosis, etc.) and clinically relevant phenotypic traits are elicited from the complex interaction between a subset of multiple gene products and environmental factors. High resolution melt (HRM) analysis is the quantitative analysis of the melt curve of a DNA fragment following amplification by PCR and can be considered the next-generation application of amplicon melting analysis. It is a low-cost, readily accessible technique that merely requires a real-time PCR detection system with excellent thermal stability and sensitivity and HRM-dedicated software. However, careful sample preparation and planning of experimental and assay design are crucial for robust and reproducible results. The following guidelines assist in the development of such assays.
Sample Selection and Quality Control
qPCR with HRM analysis is a robust technology but, as with most assays, good sample preparation will result in solid, quantifiable data. To ensure quality data:
- Use only samples with A260/280 and A260/230 ratios in the range of 1.8–2.2 and 1.6–2.4, respectively
- Examine DNA integrity by gel electrophoresis to ensure the presence of undegraded, high molecular weight DNA fragments
- Apply appropriate reference gene as an internal amplification control and to normalize for concentration variation between samples
- Minimize EDTA concentration in the DNA solution, because EDTA can interfere with the activity of some of the enzymes used in the downstream reactions
HRM-Compatible Saturating Dyes
HRM analysis relies upon the ability to analyze subtle changes in melt kinetics that typically require a dsDNA intercalating, saturating dye (Figure 1). These dyes are much less inhibitory to PCR than SYBR® Green I dye and, consequently, can be used at higher (saturating) concentrations to enable consistent and superior discrimination of PCR-amplified DNA (Monis et al. 2005, Mao et al. 2007). Several dye choices are available, the most prevalent being EvaGreen®, LCGreen, SYBR® GreenER™, and SYTO 9 dyes. Bio-Rad’s Precision melt supermix is a ready-to-use real-time PCR reagent optimized with EvaGreen dye for specificity and post-PCR HRM analysis using any HRM–enabled real-time PCR system.
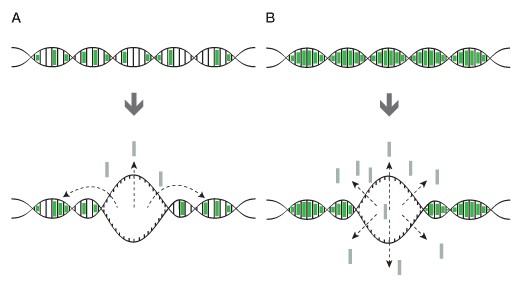
Fig. 1. Saturating and non-saturating dyes. A, when using a non-saturating dye, such as SYBR® Green I, dye molecules can relocate to unmelted regions of dsDNA during melting of DNA, which results in a small or nonuniform temperature shift in the melt curve; B, when using a saturating dye, the dye molecules from the melted region cannot relocate to the unmelted portion of the fully saturated amplicon, resulting in melt profiles that more accurately reflect DNA sequence.
Primer Design and Amplicon Length
Analyzing short DNA amplicons can assist with genotype discrimination in HRM experiments. Wherever possible, analyze amplicons smaller than 100 bp, especially when sites with a known polymorphism are investigated. It is possible to detect sequence variations with longer amplicons; however, a single base variation influences the melting behavior of a 50 bp amplicon more than a 100 bp amplicon (Figure 2). Reducing amplicon size increases the difference in signal at a given temperature (maximal at the melting temperature [Tm]) between two sequences that differ at only one nucleotide position. This in turn will increase the statistical confidence in calling particular SNPs between samples to give data of higher reliability for publication.
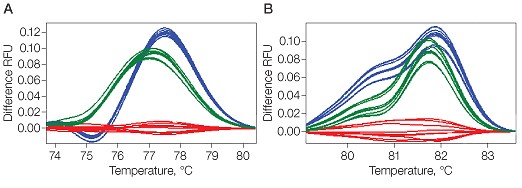
Fig. 2. Effect of amplicon size on melt curves. Difference plots for melt curves of 50 bp (A) and 100 bp (B) amplicons of wild type (A/A, —), heterozygote (A/T, —), and homozygote SNP (T/T, —) are compared. Clustering and the confidence percentage are increased by using smaller amplicons. Each trace represents a replicate. RFU, relative fluorescence units.
A number of programs are available to help design primer pairs and pick target sequences:
- Primer-BLAST — freeware option for designing oligonucleotides that was developed by the National Center for Biotechnology Information using the algorithm Primer3. Primer sequences are compared to the user-selected databases to ensure they are unique and specific for the gene of interest
- Beacon Designer (PREMIER Biosoft International) — commercially available program that designs HRM-specific primers that flank an SNP of interest so that the shortest possible amplicons with detectable melting temperature variation are generated; it is good practice to design and validate three sets of primers to increase the chances of identifying a highly robust pair
- MFOLD — for testing Amplicon sequences to ensure they do not form secondary structures during PCR; secondary structures in single-stranded or partially denatured DNA can result in inconsistent data and increase the complexity of melting profile interpretation
- DINAMelt server — useful for assessing target melt domain complexity
PCR Reaction Optimization
The success of HRM analysis depends on the quality of the individually amplified PCR products as much as the post-PCR melting protocol and the specific sequence under investigation. Each experimental parameter must be controlled from sample to sample to ensure successful and reproducible results. Analyzing real-time PCR amplification data prior to HRM analysis can be extremely useful when troubleshooting HRM experiments. The following guidelines are for the development of successful HRM experiments:
- Amplicon quality — HRM software may not be able to discriminate nonspecific reaction products if their melt profiles are similar to the target sequence of interest. Ensure only target amplicons of interest are being amplified by generating post-amplification low resolution melt profiles (0.5°C steps) and, ideally, assessing PCR products from each primer pair using agarose gel electrophoresis
- Normalize input template concentration — for best results, add consistent amounts of template to the reaction. Normalize the starting concentrations so that all amplification plots are within three Cqs of each other, that is, within less than a 10-fold range of one another
- Use an optimized annealing temperature and reaction efficiency — optimize reactions using a temperature gradient to determine the appropriate annealing temperature. Test primers and samples for reaction efficiency, which should be between 90 and 110%
- Check for aberrant amplification plots — carefully examine amplification data for abnormal amplification curve shapes. A curve with a jagged log-linear phase or one that reaches a low signal plateau compared to other reactions can indicate poor amplification or a fluorescence signal that is too low for analysis. Unsuccessful amplification can be caused by reaction inhibitors, too little dye, or incorrect reaction setup. HRM from such samples can cause low resolution and poor or inconsistent classification
- Normalize input amplicon concentrations — DNA fragment concentration affects its melting temperature; ensure every reaction has amplified to the plateau phase for reliable and reproducible melt comparisons
- Ensure sample-to-sample uniformity — within an experiment, samples must be of equal volume and contain the same concentration of binding dye. DNA melting behavior is affected by salts in the reaction mix, so the concentration of buffer, Mg
2 +, and other salts should be as uniform as possible in all samples - Allow sufficient data collection for normalization of pre- and post-melt regions — for easier data interpretation and results with tighter replicates, sufficient baseline data points must be collected. This can be easily accomplished by capturing HRM data points over at least a 10°C (or greater) window, centered over the observed melting temperature of the amplified product. A good HRM analysis software, such as Precision Melt Analysis™ software from Bio-Rad, will help automate most of these processes to ensure consistent data analysis between samples
References
Mao F et al. (2007). Characterization of EvaGreen and the implication of its physicochemical properties for qPCR applications. BMC Biotechnol 7, 76.
Monis PT et al. (2005). Comparison of SYTO9 and SYBR Green I for real-time polymerase chain reaction and investigation of the effect of dye concentration on amplification and DNA melting curve analysis. Anal Biochem 340, 24–34.
SYBR is a trademark of Molecular Probes, Inc. Bio-Rad Laboratories, Inc. is licensed by Molecular Probes, Inc. to sell reagents containing SYBR Green I for use in real-time PCR, for research purposes only. EvaGreen is a trademark of Biotium, Inc.LCGreen is a trademark of Idaho Technology Inc. SYTO is a trademark of Invitrogen Corporation