Recently, Dr. Oh, our very own in-house western blotting guru, kicked off a webinar series covering everything you could want to know about western blotting (which you can find at the end of this article). He launched the opening chapter of the western world webinar series by introducing the mathematical technique every wise scientist needs to perform to report meaningful data from their western blots — normalization.
What Is Normalization?
You may be asking yourself if normalization in western blots is the same thing as the data normalization you learned about in Stats 101. The answer is yes. Normalization is the analytical tool that allows you to accurately compare how various data points within a specific set of data are different, relative to each other.
There are multiple ways to normalize your western blotting data and in theory, they should provide you with the same desired result: the amount of a specific protein or specific proteins contained within a sample, relative to the other samples run in the same blot. When comparing any given data point to a whole set, you’ll need to know what the whole set looks like, mathematically. Each technique has its own set of considerations. Regardless of which method you ultimately decide to use, the criteria for any good normalization technique is to establish a region of linear signal response: quite simply, the increase in signal is directly and linearly proportional to the amount of protein contained within the sample.
The Two Main Methods
There are two approaches to normalization when evaluating a western blot: single protein detection and total protein normalization.
By far the most common approach to single protein detection is to use housekeeping proteins. Their abundance within a sample serves as a proxy for the entire protein population. The key to success with this approach is to base normalization on a protein that can take on the role of being an internal standard. That is to say your housekeeping protein will not be your target, but it should still be ubiquitous and consistently expressed in your sample. Luckily, thanks to the nature of housekeeping proteins, antibodies for them are readily available and detecting ubiquitous proteins is easy.
But, Dr. Oh cautions that there are constraints to using single protein detection. Positive and negative controls must be separately established, consistent protein expression levels across different samples should be tested, and a scalar linear signal response needs to be confirmed across a range of protein loading amounts (Janes 2015). All of that is necessary, but it’s also tedious and time consuming.
When conducting total protein normalization, however, all of the proteins in a sample are visualized and their total abundance serves as the basis of normalization. Not relying on a housekeeping protein is a departure from historical precedence; housekeeping normalization has been utilized for over 30 years. But, total protein normalization often proves to be a more accurate option.
Remember, the purpose of normalizing is to take into account the differences of the total protein of each sample arising from experimental error. What better way to measure such differences than actually measure the total protein abundance of each sample? Total protein normalization is accomplished with reversible staining (occurring pre-immunodetection), irreversible staining (occurring post-immunodetection), or stain-free methods. And stain-free protein normalization is unique.
What Makes Stain-Free Special?
So, what exactly is a stain-free method? A succinct way to see it is as a stained gel, just without the stain, hence the nomenclature. Instead, the gel —and, coincidentally, the blot— are visualized via fluorescence. The stain-free workflow developed at Bio-Rad distinctly avoids interfering with immunodetection, making it an attractive choice when normalizing. Further, simply running a single gel and blot can serve as the basis for all control experiments in stain-free total protein normalization. And remember the note about how great normalization establishes a scalar linear response to compare your data to? Stain-free delivers this, consistently (Figure 1).
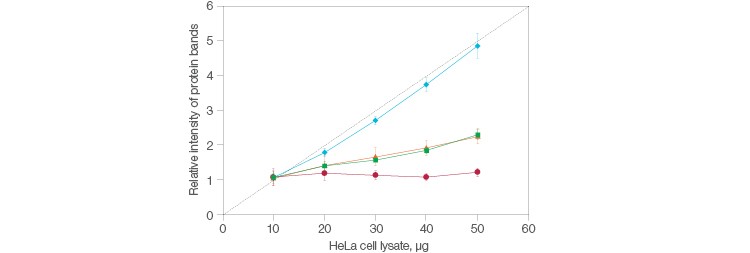
Fig. 1. Comparison of the relative intensities in protein bands between stain-free and housekeeping protein normalization methods. Stain-free (![]() ); actin (
); actin (![]() ); GAPDH (
); GAPDH (![]() ); tubulin (
); tubulin (![]() ); quantitative response (- -).
); quantitative response (- -).
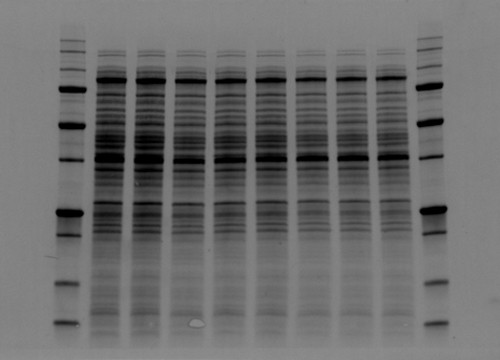
The value behind stain-free technology is that it allows scientists to visualize strong total protein signals with low background in their gels and blots that would otherwise not be possible without additional staining steps (Figure 2).
 Without stain-free technology.
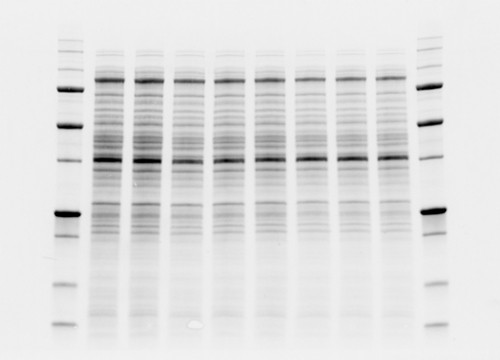
Fig. 2. Comparison between high background and low background signals in gels. Stain-free technology noticeably lowers the background signal.
Incorporating Normalization
In the world of western blotting, normalization is just the beginning. Target protein expression levels are then quantified and checked against normalized intensities. But once the data have been generated, you may be left wondering how to calculate meaningful results from it. Which would be serendipitous, as Dr. Oh addresses that in the second chapter in the webinar series. Watch it on demand.
Bearing all of this information in mind, it should be no surprise that more publications are relying on total protein normalization. And journals often openly state that of the western blotting normalization methods they prefer, total protein techniques are at the top of the list. In fact, since 2012 when it was first introduced, stain-free total normalization has appeared in over 800 publications (almost 500 of those appearing in 2017).
And even if you just haven’t gotten around to using any flavor of normalization (yet), it’s important to make sure that every variation you observe between target protein abundances and various samples is the result of actual biology. You should be confident that your data are not being skewed by experimental errors. And that is precisely where normalization can help.
Watch the Webinar and Additional Reading
Let Dr. Oh guide you through the first chapter of the world of normalizing your western blots.
From our 2016 archives, read more about total protein normalization.
References
Janes KA (2015). An analysis of critical factors for quantitative immunoblotting. Sci Signal 8, rs2.