Complex biological systems rely on the coordinated activities of individual cells. The function of these cells can differ drastically, even within a single tissue, but capturing this heterogeneity is difficult with conventional technologies that treat millions of cells as a single sample.
These approaches yield averages that mask important cell-to-cell transcriptional differences and hide the activities of subpopulations that can be crucial to tissue health and development. To better understand the contribution of individual cells in human health and to develop more targeted treatments for disease, it is important to characterize human biology at the single-cell level.
mRNA-FISH, single-cell RT-qPCR, and single-cell RNA sequencing (RNA-Seq) have emerged as popular single-cell transcriptomics technologies. We briefly discuss the pros and cons of each of these methods and demonstrate that the Illumina® Bio-Rad® Single-Cell Sequencing Solution overcomes many of the challenges of currently available platforms by allowing high-throughput and scalable sequencing of even the most challenging sample types, including large cells and small species such as nuclei.
Limitations of Traditional Single-Cell Technologies
mRNA-FISH is a microscopy-based method that uses fluorescently labeled probes to count individual transcripts of interest in fixed cells or tissues. Unlike other single-cell approaches, mRNA-FISH provides spatial information, but like other single-cell methods, mRNA-FISH is limited in the number of genes that can be analyzed in a single experiment. Because each target mRNA species needs to be assigned a spectrally distinct fluorophore, the number of genes that can be interrogated simultaneously is small.
Single-cell RT-qPCR allows investigation of a larger number of genes. When a 96-well plate is used, this method allows analysis of 1–10 genes in up to 96 cells. Throughput can be increased to 96 genes across 96 cells by using microfluidic chip-based experiments. This method, however, provides insight into just a tiny fraction of the transcriptionally active genes in a given cell.
Both mRNA-FISH and single-cell RT-qPCR share a second but significant limitation — they require a priori knowledge of which transcripts are of importance so that appropriate probes or primers can be designed. This makes these methods powerful tools for monitoring expression patterns of known genes of interest, but poorly suited for discovery of novel biomarkers or previously unknown contributors to a biological process.
Because of these limitations, single-cell RNA-Seq has emerged as an attractive method for single-cell analysis. This approach allows interrogation of gene expression of thousands of genes in hundreds to thousands of cells in a single experiment and has been used to provide in-depth insights into difficult-to-characterize processes and phenomena such as cell-to-cell heterogeneity in tissues and tumors (Tirosh et al. 2016), cellular taxonomy of nervous system and stem cells (Grün et al. 2016, Tasic et al. 2016), and therapeutic efficacy (Kim et al. 2016) at a single-cell level.
Traditional single-cell RNA-Seq methods, however, either struggle with the isolation of single large and small cells or require throughput-limiting upstream cell-sorting steps. By using proprietary droplet-based partitioning to isolate single cells, the Illumina Bio-Rad Single-Cell Sequencing Solution overcomes these challenges and thus, allows large-scale gene-expression profiling of a wide range of cell types.
A Simple and Scalable Single-Cell RNA-Seq Workflow
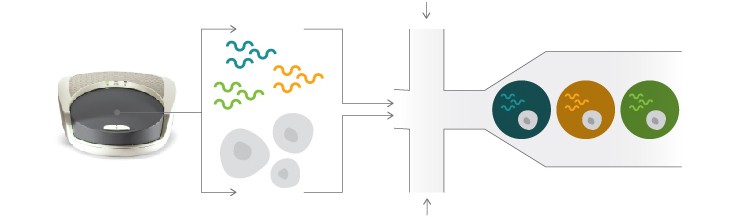
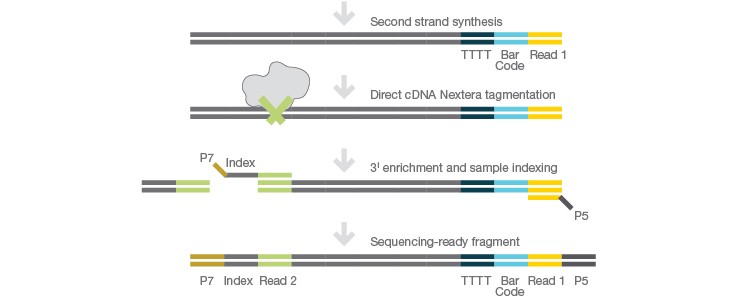
The Illumina Bio-Rad Single-Cell Sequencing Solution uses Bio-Rad’s Droplet Digital™ technology to capture single cells in nanoliter-sized droplets along with all of the reagents required for cell lysis and barcoding. Each individual cell is lysed in its respective droplet and individual transcripts are assigned a unique molecular identifier (UMI). cDNA from all droplets is then pooled for second-strand synthesis followed by library preparation using Illumina’s Nextera® tagmentation technology (Figure 1).
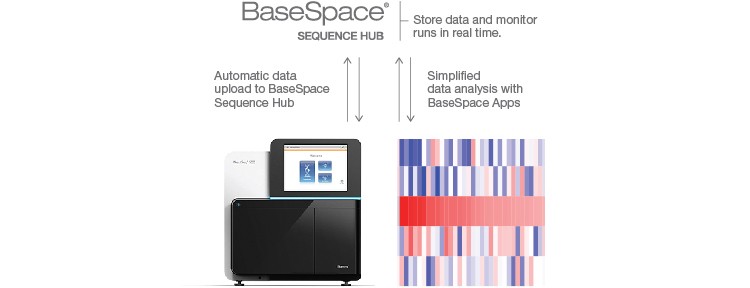
Sequencing-ready fragments are then sequenced using Illumina’s MiSeq®, NextSeq®, HiSeq®, or NovaSeq® Systems, and resulting data are subsequently analyzed with the BaseSpace® Sequence Hub SureCell™ RNA Single-Cell App followed by data visualization and gene expression analysis using FlowJo’s SeqGeq Software. This sample prep to analysis workflow allows isolation of hundreds to thousands of cells per sample (Figure 1).
Single-Cell RNA-Seq Workflow
Isolate and barcode single cells using the Bio-Rad ddSEQTM Single-Cell Isolator.
Prepare library using Nextera technology.
Sequence efficiently using Illumina sequencing platforms and analyze and store data with the BaseSpace Sequence Hub.
Visualize and analyze gene expression with SeqGeq Software.
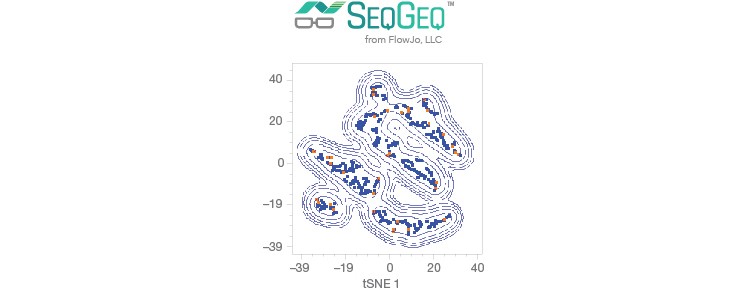
Fig. 1. Single-cell RNA-Seq workflow. Single cells are easily isolated and sequenced using the scalable Illumina Bio-Rad Single-Cell Sequencing Solution.
Successful Sequencing of Large Single Cells
One of the remaining challenges of traditional single-cell RNA-Seq methods is cell size. Conventional methods are able to generate high-quality data for cells ranging in size from 10 to 25 µm, but large cells, such as cardiomyocytes and adipocytes, have posed challenges for single-cell RNA-Seq. The Illumina Bio-Rad Single-Cell Sequencing Solution allows generation of high-quality sequencing data even from these large cells: 1,077 single adipocytes, ranging in size from 40 to 100 µm, were sequenced in a single run, generating high-quality sequences of 16,085 transcripts (UMIs) and 4,616 genes per cell (Figure 2A). This method also allowed clear identification of transcripts associated with single cells, as demonstrated by the steep knee (red line) in a UMIs-per-cell plot (Figure 2B).
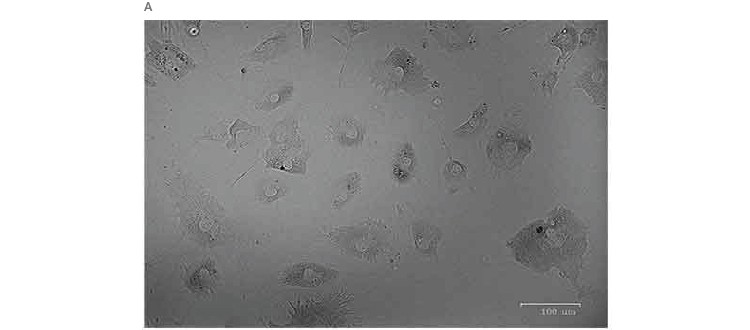
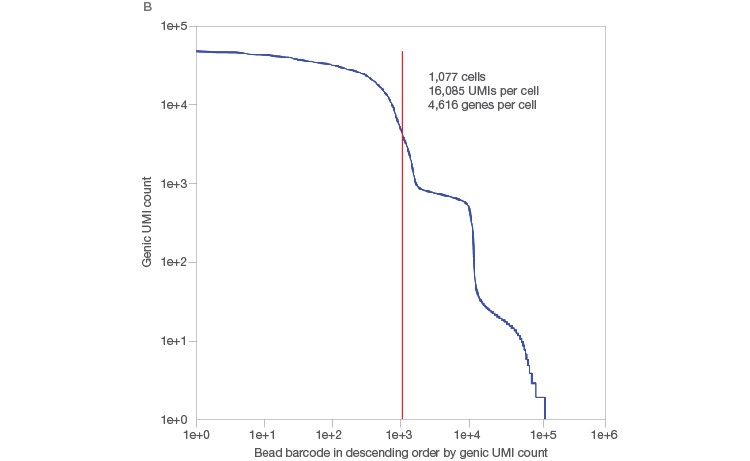
Fig. 2. Single-cell sequencing of large cells. A, single adipocytes, ranging in size from 40 to 100 µm, were sequenced using the Illumina Bio‑Rad Single-Cell Sequencing Solution. B, this workflow yielded high-quality sequencing data, as demonstrated by the large number of UMIs/cell, and allowed clear identification of transcripts originating from whole cells, as indicated by a sharp, steep knee (red line) in the UMIs-per-cell plot. UMI, unique molecular identifier.
High-Quality Sequencing Data from Small Species
A second challenge for traditional single-cell RNA-Seq methods are small species such as nuclei (6 µm). Current single-cell methods require single-cell suspension of fresh tissue or cells. This can prove challenging for tissues that are difficult to dissociate, such as the cells of the nervous system. Thus, the ability to sequence individual nuclei is of great value to understanding the human nervous system and neurodegenerative disease (Lake et al. 2016).
Using the Illumina Bio-Rad Single-Cell Sequencing Solution for RNA-Seq, 548 single nuclei were successfully isolated and sequenced (Figure 3A). Nuclei yielded a lower number of transcripts as whole cells (Figure 3B), as expected (Barthelson et al. 2007). Excellent purity of 98.2%, and separation of individual transcriptomes from mouse and human cells, demonstrated that very few droplets generated by the ddSEQ Single-Cell Isolator included more than one nucleus. Thus, this workflow can be used to successfully sequence single nuclei (Figure 3B, unpublished data).
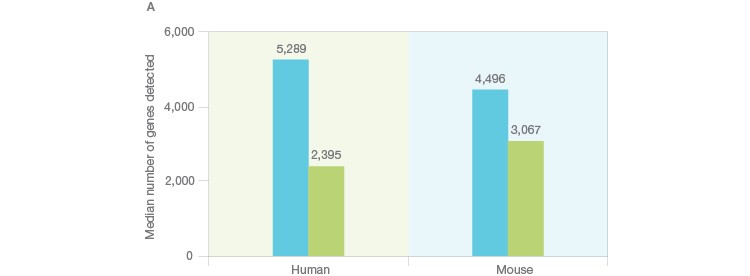
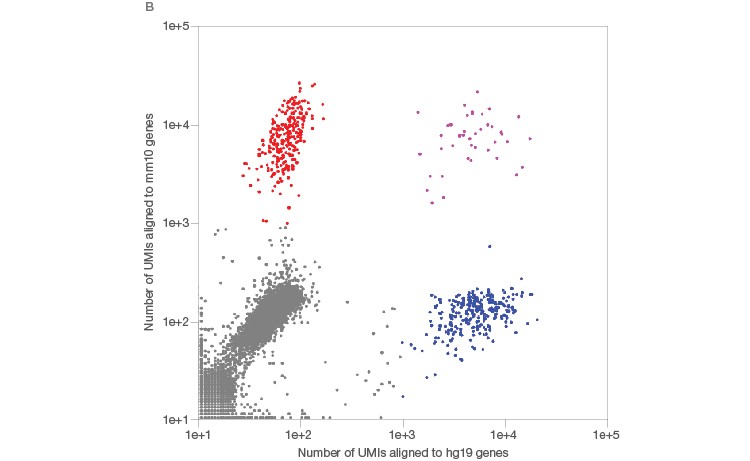
Fig. 3. Single-cell sequencing of small species. A, whole single cells and single nuclei from mice (3T3) or humans (K562) were sequenced using the Illumina Bio-Rad Single-Cell Sequencing Solution. Isolated nuclei yielded half of the number of unique transcripts detected in whole cells, indicating successful isolation of nuclei. Whole cells (■); nuclei (■). B, mouse (3T3, red) and human cells (K562, blue) were then mixed at a one-to-one ratio prior to nuclei isolation and single-nucleus sequencing. The low doublet rate (pink) in these mixed-species experiments demonstrates that single nuclei can be successfully isolated and sequenced using the Illumina Bio-Rad Single-Cell Sequencing Solution. UMI, unique molecular identifier.
Conclusion
The Illumina Bio-Rad Single-Cell Sequencing Solution allows sequencing of single cells across a wide size range. In addition, the workflow is easily scalable to accommodate experiments that range from hundreds to thousands of cells, making this platform ideal for large-scale screens during the discovery phase, as well as smaller-scale experiments during the development phase of a therapeutic. The ability to quickly and efficiently map the transcriptomes of tens of thousands of individual cells to identify and track subpopulations of interest will undoubtedly contribute to a better understanding of disease states and will hopefully contribute to the development of more effective and more targeted personalized treatments.
References
Barthelson RA et al. (2007). Comparison of the contributions of the nuclear and cytoplasmic compartments to global gene expression in humans. BMC Genomics 8, 340.
Grün D et al. (2016). De novo prediction of stem cell identity using single-cell transcriptome data. Cell Stem Cell 19, 166–277.
Kim KT et al. (2016). Application of single-cell RNA sequencing in optimizing a combinatorial therapeutic strategy in metastatic renal cell carcinoma. Genome Biol 17, 80.
Lake BB et al. (2016). Neuronal subtypes and diversity revealed by single-nucleus RNA sequencing of the human brain. Science 352, 1,585–1,590.
Tasic B et al. (2016). Adult mouse cortical cell taxonomy revealed by single cell transcriptomics. Nat Neurosci 19, 335–346.
Tirosh I et al. (2016). Dissecting the multicellular ecosystem of metastatic melanoma by single-cell RNA-Seq. Science 352, 189–196.
For Research Use Only. Not for use in diagnostic procedures.
SeqGeq is a trademark of FlowJo, LLC
First published in GEN Magazine and on genengnews.com on October 1, 2017.